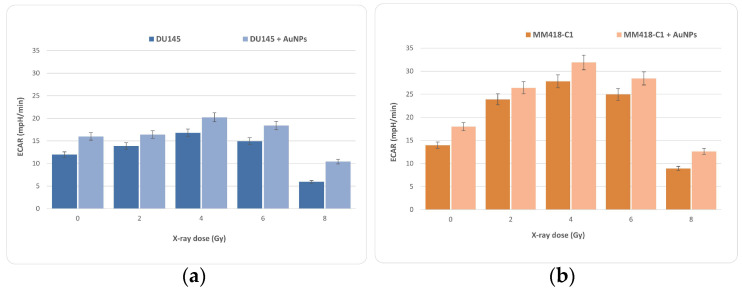
Figure 8.
Data from the glycolysis stress test which represent extracellular acidification rate (ECAR) traced from a mitochondrial stress test when DU145 (a) and MM418-C1 (b) cell lines were irradiated with and without AuNPs. Data represent mean values from 20 wells ± standard deviation of three replicate samples.

