
Figure 4.
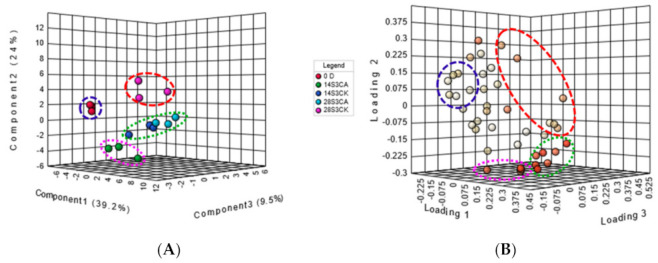
PLS-DA analysis of peach fruit VOC under CA treatment during shelf-life. (A) PLS-DA score plot of peach fruit VOC, the left one is the subfigure A; (B) Loading plot of peach fruit VOC with PLS-DA model, the right one is the subfigure B. The volatile compounds circled in different color circles were listed in Table S1.