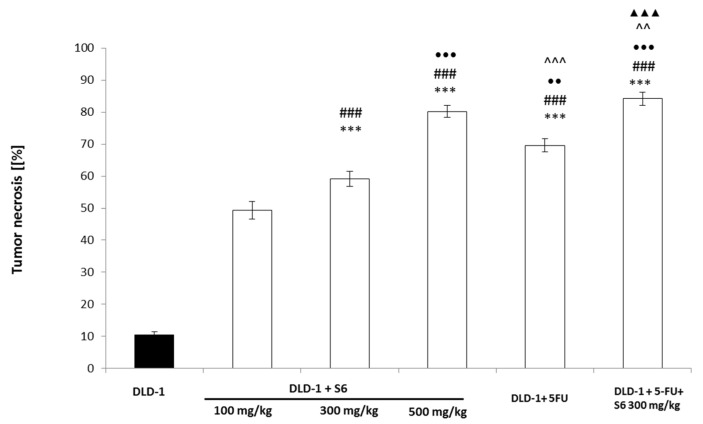
Figure 5.
Tumor necrosis in induced CRC tumors from experimental groups. The results are expressed as the mean ± SEM for each group. *** p < 0.001 compared with the DLD-1 group; ### p < 0.001 compared with the DLD-1 + S6 100 mg/kg; •• p < 0.01 and ••• p < 0.001 compared with the DLD-1 + S6 300 mg/kg group; ^^p < 0, 01 and ^^^ p < 0.001 compared with the DLD-1 + S6 500 mg/kg group; ▲▲▲ p < 0.001 compared with the DLD + 5-FU.

