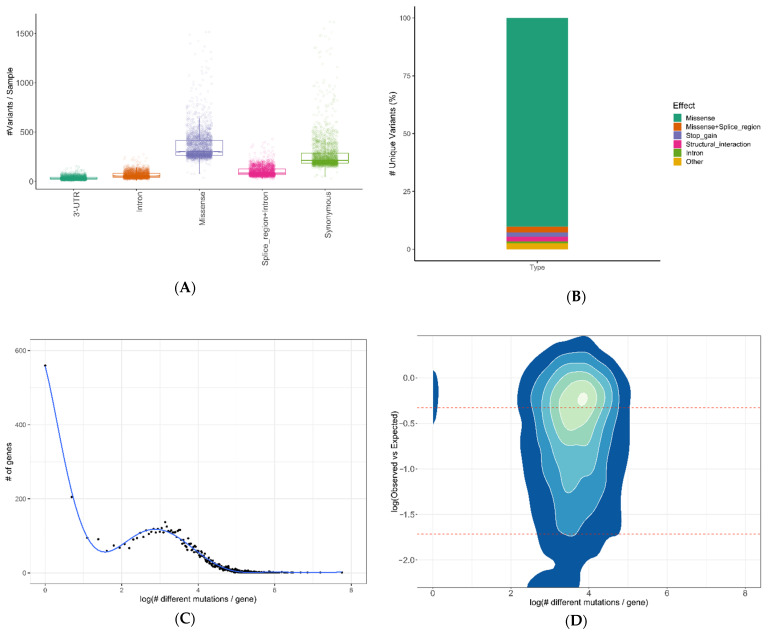
Figure 3.
Genomic variability: (A) Number of variants detected per sample, classified by the five most abundant mutation classes. (B) Percentage of unique mutations detected in all 2474 patients, by class. (C) Genes sorted by the number of unique mutations detected (log-scaled). (D) Density map of gene constraints determined by gnomAD by the number of unique mutations detected (log-scaled). The red lines represent the first and forth quartiles for C and D. 3′UTR (variant in 3′ untranslated Region); intron (variant in non-coding region); missense (non-synonymous variant in coding region); splice_region + intron (splice-site variant in non-coding region); synonymous (variant in coding region that produces the same amino acid); stop-gain (variant that causes a stop codon); structural interaction (interaction loci that are likely to be supporting the protein structure).

