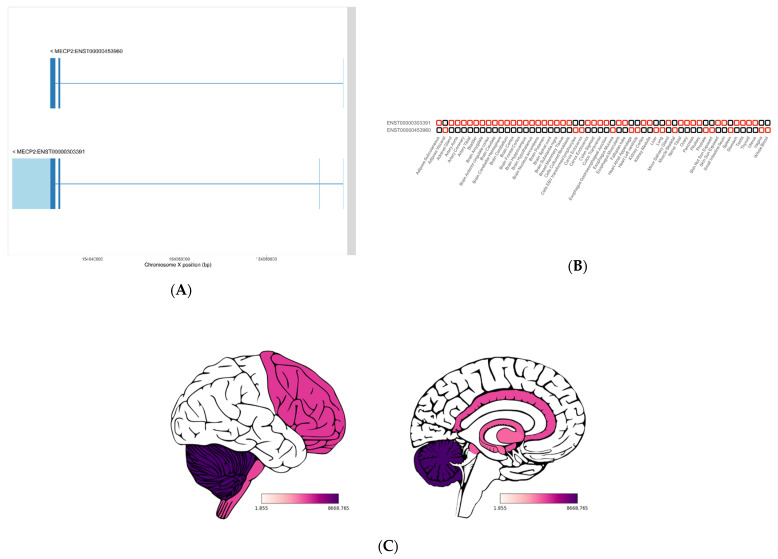
Figure 6.
MECP2 transcript depiction: (A) MECP2 schematic diagram of the two major isoforms. (B) Transcript switch between the different MECP2 isoforms. (C) MECP2 gene expression in different brain areas. In A, UTR sequences are represented in light blue. In total, 14 rank 1 transcript switches are detected among the 54 tissues studied in the TREGT database. The GTEx brain expression profile (TPMs) is represented in C using the cerebroViz R package; cerebroViz output for exterior (left) and sagittal (right) views.

