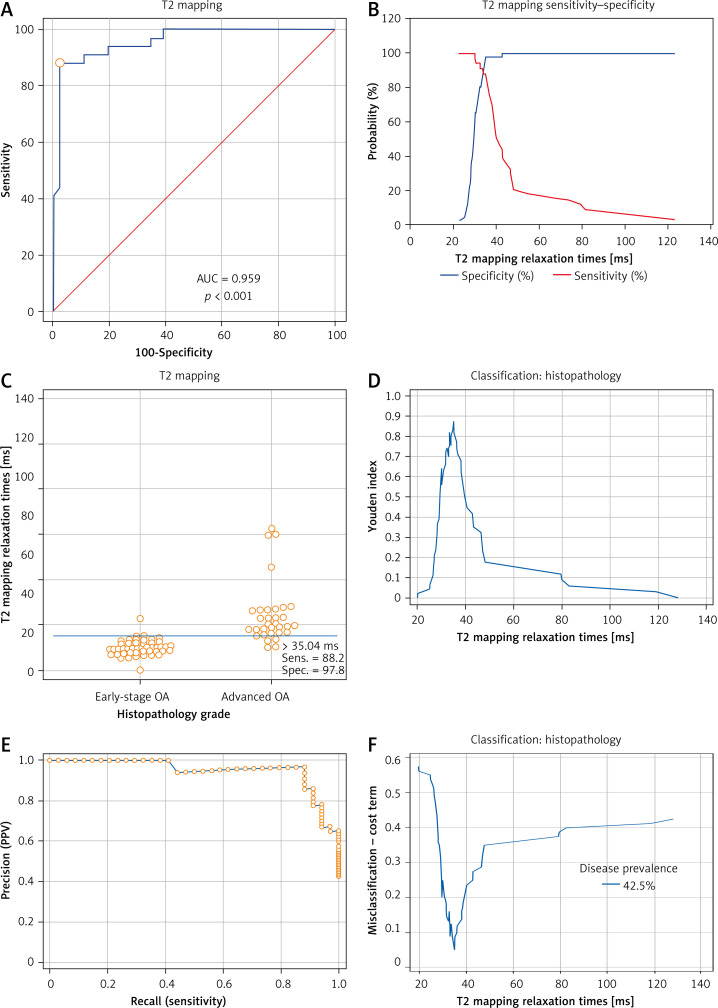
Figure 8.
Receiver operating characteristic (ROC) curve and analysis of T2 mapping. A – ROC curve of T2 mapping was used to determine the distinguishing criterion between early-stage OA and advanced OA. AUC of ROC curve was 0.959 (95% CI: 0.890–0.991, SE = 0.0206, p < 0.001). B – The sensitivity curve and specificity curves are displayed for estimation of the optimal criterion of the ROC curve which was the intersection point of the sensitivity-specificity curve. C – Interactive dot diagrams of early OA and advanced OA are displayed with optimal criterion lines. D – The highest point of the Youden index was at the same optimal criterion. E – Precision recall (PR) curves of T2 mapping are also shown. F – The lowest point of the misclassification-cost term (MCT) plot was estimated at the same point as the optimal criterion

