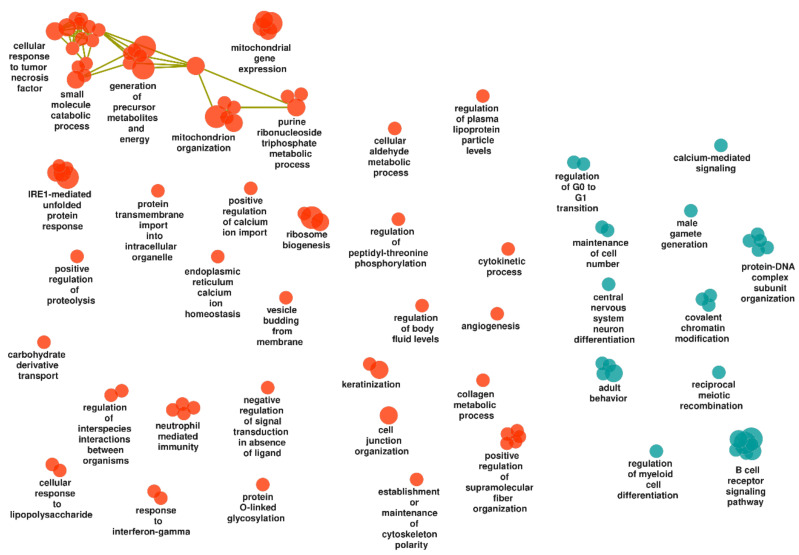
Figure 3.
Gene ontology biological processes identified in non-inflamed UC mucosa compared to control mucosa and visualized as a functionally grouped network of gene sets that remain after ClueGO analysis. Orange and blue-green nodes represent upregulated and downregulated processes, respectively, and olive-green edges represent similarities based on gene content in each gene set.

