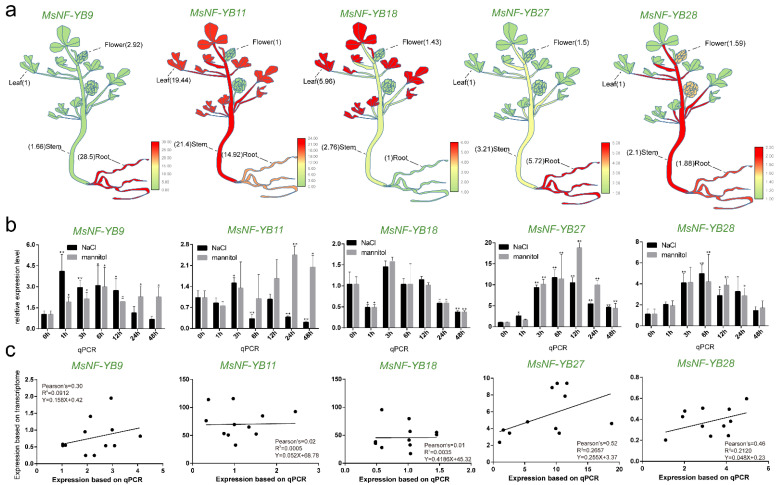
Figure 9.
Quantification of gene expression levels of selected NF-YB genes from M. sativa using RT-qPCR. (a) Expression level of MsNF-YB genes in different tissues. (b) Expression level of MsNF-YB genes under NaCl and mannitol stress. Data are average of three independent biological samples ± SE, and vertical bars indicate standard deviation. ** indicates p < 0.01, and * indicates p < 0.05. (c) Correlation analysis of RT-qPCR and transcriptome (NaCl and mannitol) results for MsNF-YB genes. Pearson’s r indicates the Pearson correlation coefficient.

