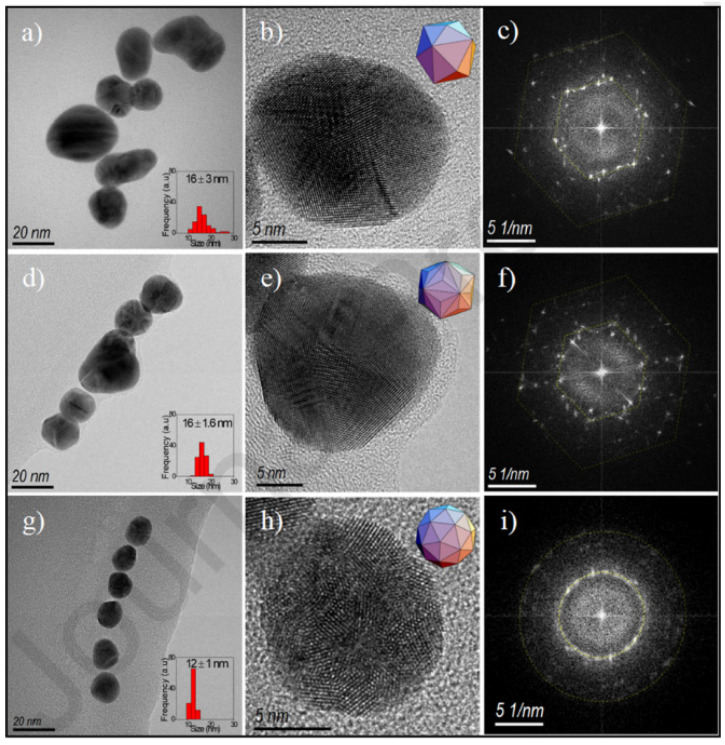
Figure 3.
The TEM images of AuNPs are shown in the first column—(a,d,g)—with graphs of size distribution shown in the insets. The HRTEM images in the second column—(b,e,h)—are polyhedral insets. We can see the SAEDs in the third column—(c,f,i) [60]. Copyright Elsevier 2021.

