Figure 1.
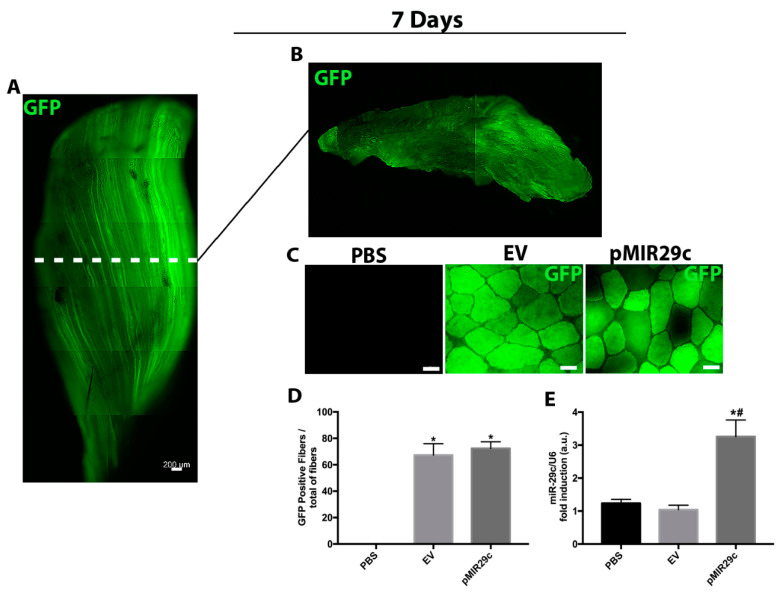
Plasmid transfection efficiency and levels of miR-29c in skeletal muscle. (A) Representative photograph composition of tibialis anterior and (B) the correspondent transversal section (GFP in green). (C) Representative photomicrograph of tibialis anterior muscle cross-section at 7 days of miR-29c overexpression showing positive (green) fibers. (D) Efficiency of transfection of the EV and miR-29c expression plasmid 7 days after electrotransfer. (E) RNA levels of miR-29c were determined by qPCR in muscles 7 days after electrotransfer. Data were expressed as a percentage of total fibers and arbitrary units (au) as mean and SEM (n = 4–5 per group) and were corrected by the endogenous U6 RNA. Statistical analysis included one-way ANOVA followed by Tukey’s posthoc test and the Kruskal–Wallis test followed by Dunn’s posthoc test. * p < 0.05 vs. PBS and # p < 0.05 vs. EV group.

