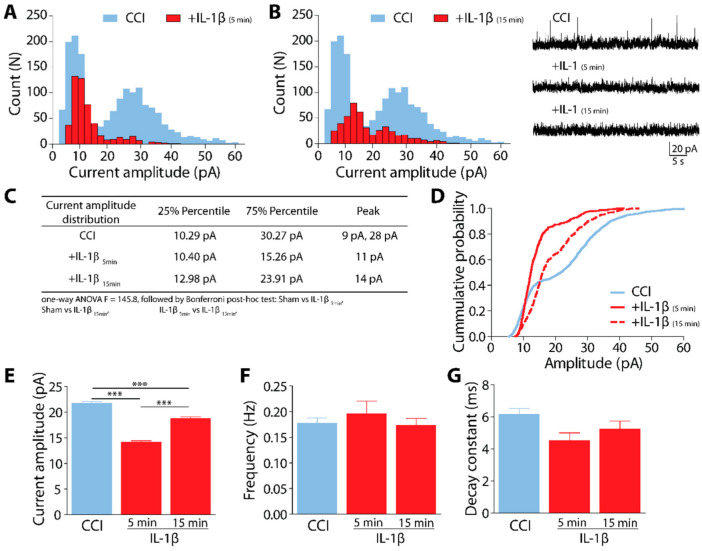
Figure 3.
Glycinergic sIPSCs in CeA slices from CCI animals are differentially modulated by IL-1β. (A,B) Spontaneous current amplitude distribution plots for CCI slices, before and after 5 min (A) or 15 min (B) IL-1β (10 ng/mL). Inset: representative synaptic sIPSC glycinergic currents in the presence of CNQX (10 μM), APV (50 μM), bicuculline (10 μM), clamped at +20 mV. (C) the table summarizes the distribution data from (A,B). (D) Cumulative probability histogram of amplitude in CeA neurons in CCI, before (blue line) and after 5 min (continuous red line) and 15 min (discontinuous red line) of IL-1β. (E–G) Comparative plots of the glycinergic sIPSC currents parameters, as mean ± SEM, *** p < 0.001 (n = 5 CCI, 10 cells; 10 cells + IL-1β).

