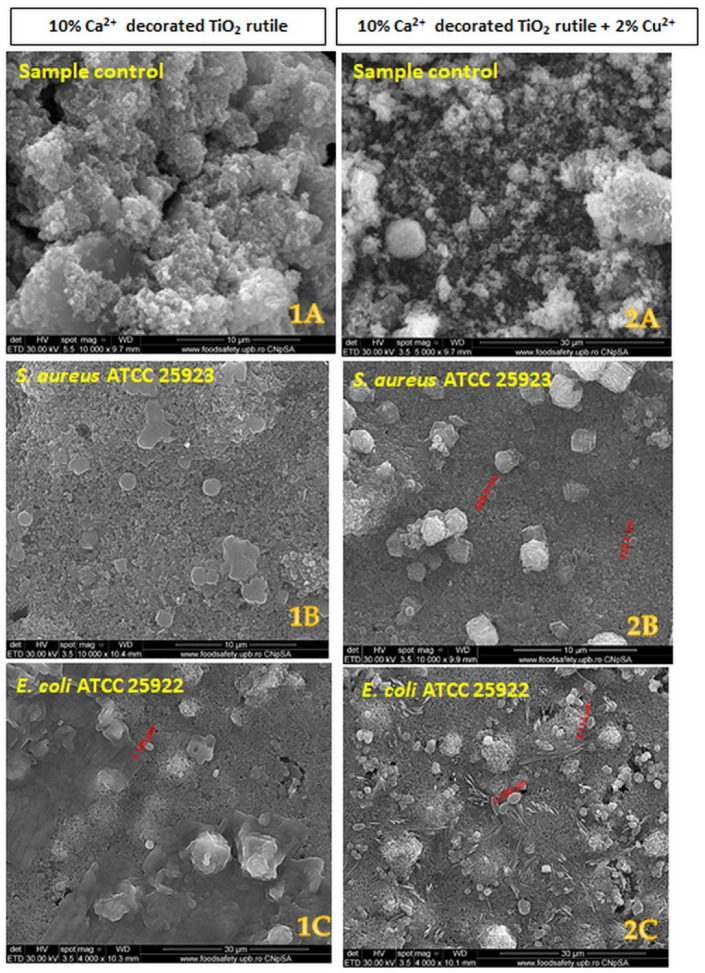
Figure 8.
Scanning electron micrograph of the two pigments before and after 30 min of contact with the Gram-positive and Gram-negative bacterial cells. The left column represents sample 1; the right column represents sample 2. The bacterial strains are listed on the images. The diameters of the bacterial cells are marked on each image: (1A) and (2A)—controls (samples 1 and 2 that aren’t put in contact with bacterial cells); (1B)—no bacterial cells observed; (2B)—626 nm; (1C)—1.155 µm; (2C)—2.720 and 2.114 µm.

