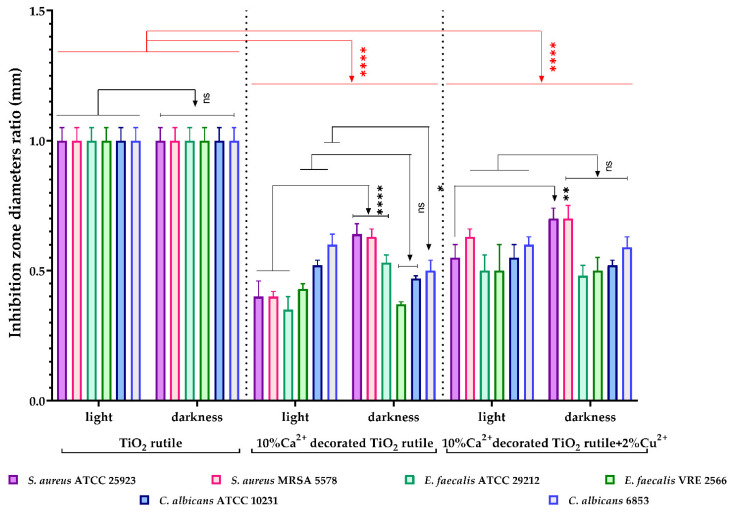
Figure 10.
Graphic representation of the inhibition zone diameters expressed as the diameter ratio, obtained for the tested C. albicans and Gram-positive strains, after incubation in two different conditions: visible light and darkness. The results were compared using two-way ANOVA and Dunnett’s multiple comparisons tests; ns—not significant; * p < 0.05; ** p < 0.003; **** p < 0.0001.

