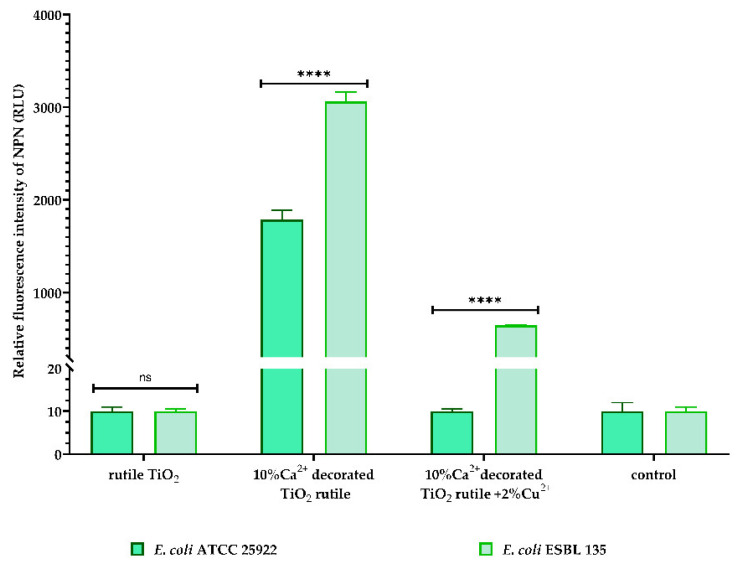
Figure 12.
Outer membrane permeabilization of E coli strains measured by detecting the fluorescence intensity of NPN after 30 min of contact with the samples. All the data are shown as the mean ± SD of the three independent experiments. p-values were determined via two-way ANOVA and Dunnett’s multiple comparisons tests (ns—not significant, **** p < 0.0001 vs. untreated control).

