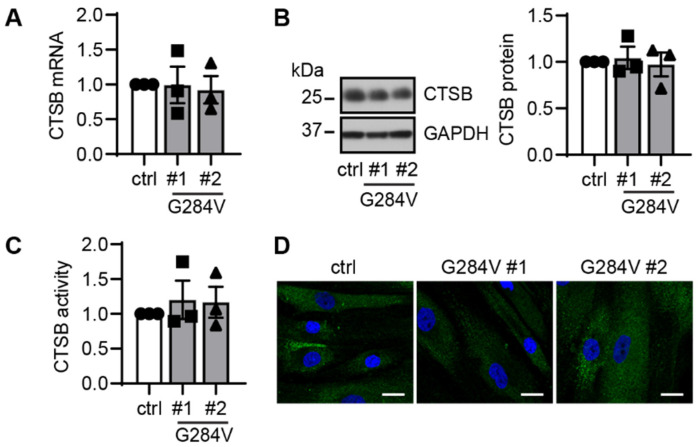
Figure 4.
Functional analysis of CTSB in patient-derived skin cells. (A) qRT-PCR showed comparable mRNA levels in both CTSB mutant fibroblasts and the controls cells. (B) Representative western blot images of control and two CTSB mutant fibroblast lines (left). Western blot quantification showed similar levels of total CTSB protein levels in both CTSB mutant, and the WT control cells (right). (C) CTSB activity assay using cell lysates showed no differences in total enzymatic activity in the mutant fibroblast compared to the control. Circle—control, square—patient #1 carrying CTSB G284V, triangle—patient #2 carrying CTSB G284V. (D) Representative images of CTSB immunofluorescence staining (green) in fibroblasts at baseline condition. Scale bar: 20 µm. n = 3 independent experiments. Data are normalized to set control as 1 and are shown as mean with standard error. One-way ANOVA.

