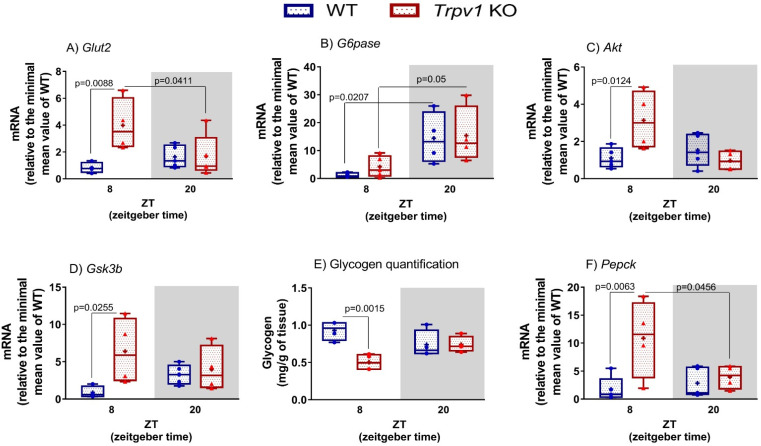
Figure 2.
Hepatic glucose metabolism in the absence of TRPV1 channels. (A–D,F) Relative transcripts of hepatic genes related to glucose metabolism in C57BL/6J WT and Trpv1 KO mice at ZT8 (physiological fasting) and ZT20 (eating phase). Results of mRNA quantification are shown as median, quantiles, and maximum and minimum expression values of gene transcripts normalized by 18S ribosomal RNA and expressed relative to the minimum mean value of WT mice. ₊ represents the mean (n = 4–5). Significant differences between ZTs and between genotypes were demonstrated by two-way ANOVA, followed by the Bonferroni post-test. (E) Hepatic glycogen quantification is expressed as mass (mg/g of tissue).

