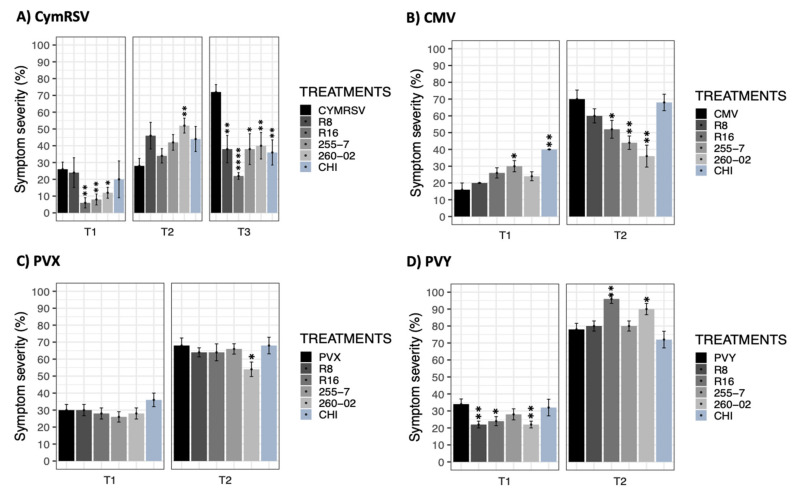
Figure 3.
Bar graphs reporting the results based on mean percentage values of symptom severity. (A) CymRSV, (B) CMV, (C) PVX, and (D) PVY display the measurements taken in days post-inoculation (dpi) intervals represented as T1 = 5 dpi, T2 = 7 dpi, and T3 = 12 dpi. Each bar represents a different treatment: nontreated, virus-infected plants (CymRSV, CMV, PVX, and PVY) and virus-infected plants treated with either strain R8 [Paraburkholderia], R16 [Paenibacillus], 255-7 [Pantoea], 260-02 [Pseudomonas], or a chitosan-based product (CHI). Error bars indicate standard error. Asterisks indicate significant differences among the results according to a nonparametric Wilcoxon rank-sum test followed by Bonferroni methods compared with virus-infected, nontreated plants (* for p < 0.05, ** for p < 0.01, and **** for p = 0.000).

