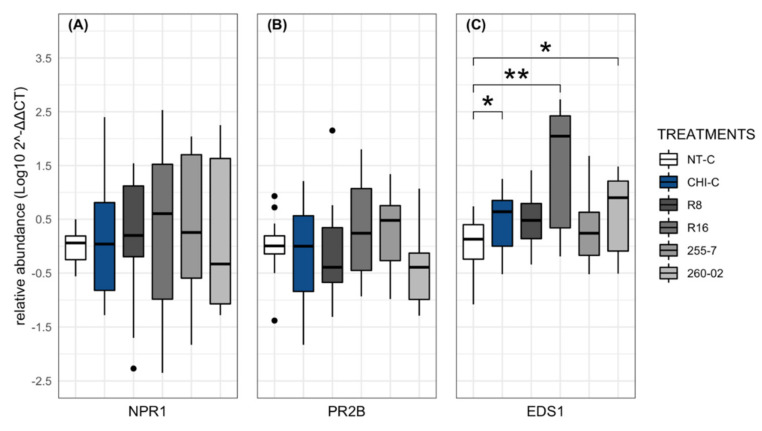
Figure 7.
Relative gene expression assay in N. benthamiana plants (treated and nontreated) with ePGPB strains and chitosan indicator (CHI-C) sampled at 24 hpi: (A) NPR1, (B) PR2B, and (C) EDS1. The y–axis represents 2−ΔΔCT value expressed as the Log10 of each gene normalized on the PP2A gene, and x–axis represents different treatments. Bars represent the standard error of mean values at a 95% confidence interval. Asterisks indicate significant difference according to a nonparametric Wilcoxon rank-sum test followed by p-values based on Bonferroni methods compared with nontreated group (* for p < 0.05 and ** for p < 0.01).

