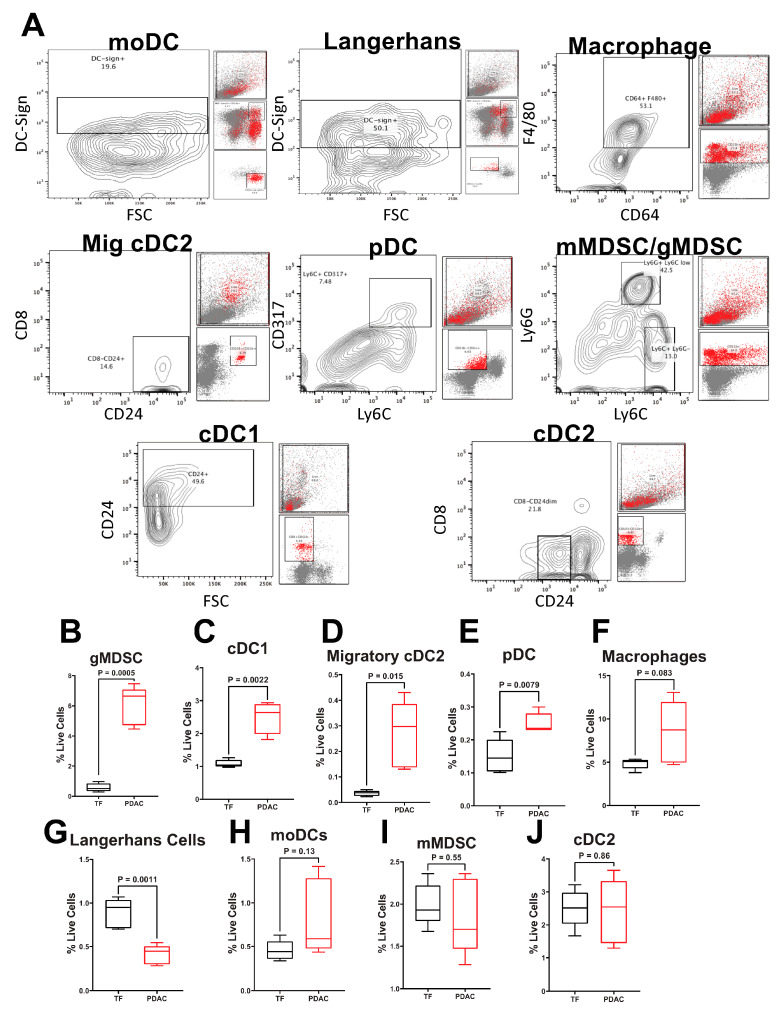
Figure 1.
Pancreatic Cancer Alters Murine Splenocyte Immune Populations. Flow cytometry was performed on splenocytes from five different tumor-free (TF) or pancreatic tumor-bearing (PDX-1-Cre, LSL-KrasG12D, LSL-Trp53−/−) mice. All tumor-bearing mice were inoculated with tumor cells at the same time. (A) Representative contour plots gating for each of the nine populations in PDAC mice is shown. Back-gating of each population is provided to the right of each plot. Quantification of splenocyte live cell percentages of (B) gMDSC (CD11b+Ly6G+Ly6C+/−); (C) cDC1 (CD8+CD11b−CD103−CD24+); (D) migratory cDC2 (CD8−CD11b+CD103+CD24++); (E) pDC (CD11b−CD11c+Ly6C+CD317+); (F) Langerhans DC (MHC class II+CD11b+CD11c+Ly6C−DC-sign+; (G) macrophage (CD11b+CD64+F4/80+); (H) moDCs (MHC class II+CD11b+CD11c+/−Ly6C+DC-sign+); (I) mMDSC (CD11b+Ly6G−Ly6C+), and (J) cDC2 (CD8−CD11b+CD103+CD24++). Per animal percent live cells calculated by dividing the total number in each population by the total number of live cells stained. Biological replicates represent staining and analyses from five different animals per group. All samples analyzed were from a single experiment with five biological replicates per group. Individual biological replicates were combined into box and whisker plots representing the median and interquartile range (25–75%) with whiskers representing the outlying 25%. All statistical comparisons are unpaired t-tests with a Welch’s correction.

