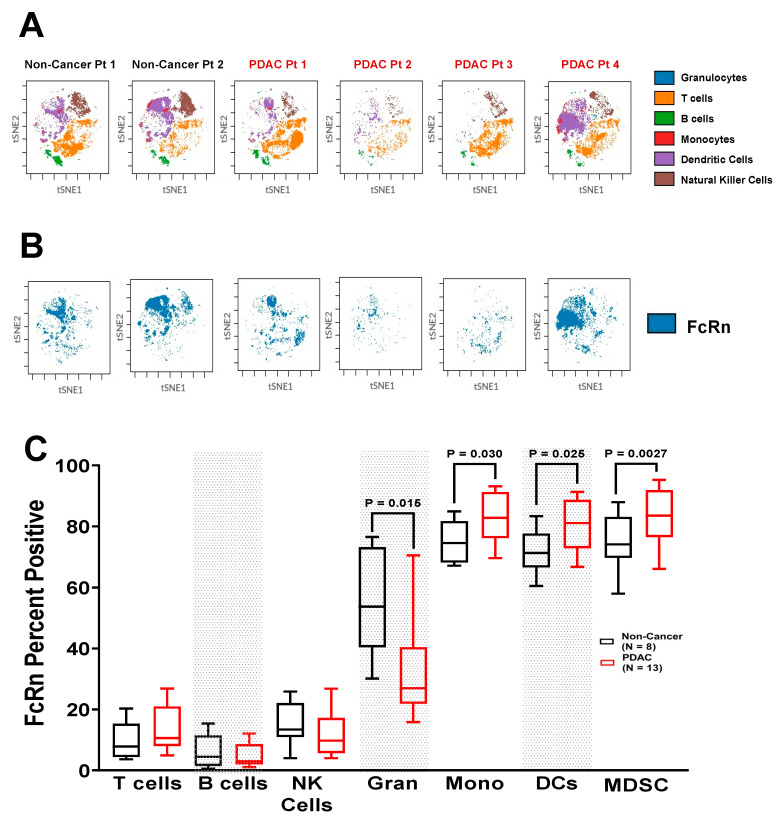
Figure 4.
Circulating Myeloid Cells Expressing FcRn are Elevated in PDAC Patients. PBMCs of non-cancer (n = 8) and PDAC (n = 13) patients were permeabilized and stained for FcRn. Representative t-SNE plots of the (A) most prevalent cell populations; and (B) FcRn localization from two individual non-cancer and four individual PDAC patients are shown. (C) Quantification of FcRn expression within each immune population. Granulocytes are denoted as Gran, and monocytes are denoted as Mono. Biological replicates represent staining and analyses of each individual sample. Individual biological replicates were combined into box and whisker plots representing the median and interquartile range (25–75%) with whiskers representing the outlying 25%. All statistical comparisons are unpaired t-tests with a Welch’s correction.

