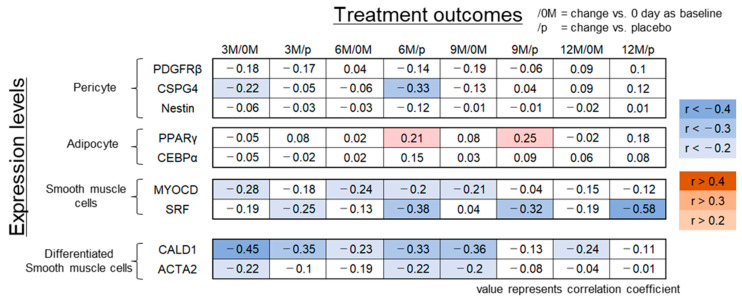
Figure 1.
Correlation analysis between treatment outcome scores at each time point during the clinical study using DSC cell lines [21] and expression levels of differentiation markers. The results of correlation analysis between the treatment outcome score at 3, 6, 9, and 12 months vs. that at 0 day (3 M/0 M, 6 M/0 M, 9 M/0 M, and 12 M/0 M) or vs. the placebo (3 M/p, 6 M/p, 9 M/p, and 12M /p) and the expression levels of the indicated differentiation markers are shown. Each value represents the correlation coefficient. Red: positive correlation; blue: inverse correlation.

