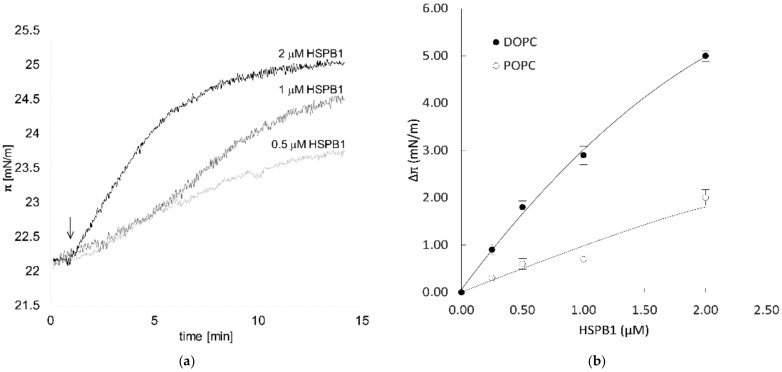
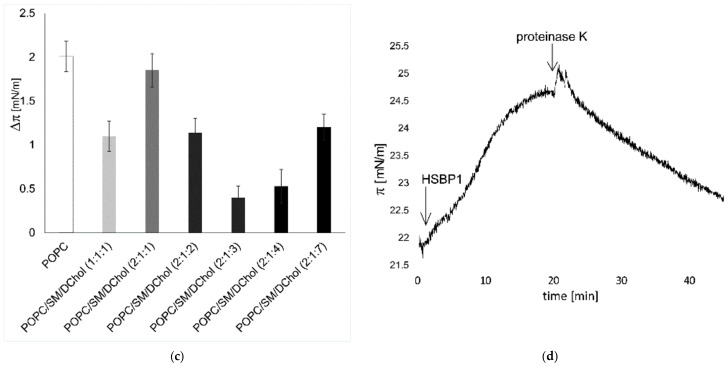
Figure 1.
Lipid preference of HSPB1 measured by monolayer surface pressure. (a) HSPB1 was injected underneath the lipid monolayer of POPC and the surface pressure (πi) was measured after pressure equilibration. The black arrow indicates the time of injection. (b) Surface pressure change in DOPC or POPC monolayers five minutes following the addition of different amounts of HSPB1 underneath monolayers formed at an initial surface pressure of 22 mN/m. (c) Comparison of 1 µM HSPB1-induced maximum surface pressure increase in monolayers of pure POPC and different ternary lipid mixtures of POPC, SM, and DChol (πI = 22 mN/m). (d) Effect of proteinase K treatment on the interaction of HSPB1 with POPC monolayers. Arrows indicate the time of HSPB1 (1 µM) and proteinase K (1 µg/mL) injection underneath the monolayer. Solid and dashed lines represent polynomial fitted curves.


