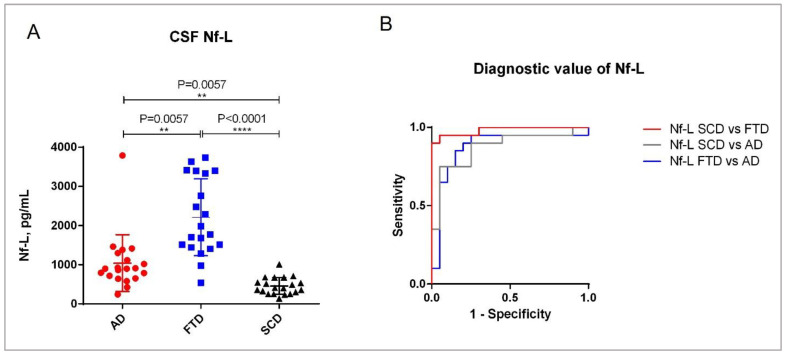
Figure 7.
Clinical validation of the Nf-L ELISA. (A) CSF Nf-L concentrations in different diagnostic groups. The analysis was carried out using a Kruskal–Wallis analysis of variance (ANOVA) for multiple comparisons. (B) ROC curves. The graph shows the diagnostic value of CSF Nf-L in the clinical diagnostic groups AD and FTD, as well as in SCD. (On Graphpad Prism, **: p ≤ 0.01; ****: p ≤ 0.0001).

