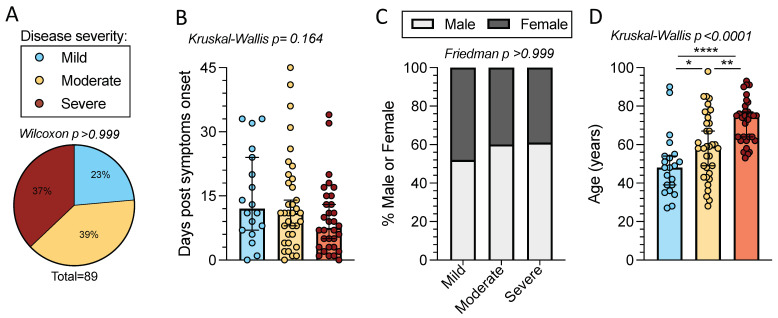
Figure 1.
Time from symptom onset, sex, and age distributions of mild, moderate, and severe acute COVID-19 subjects. Peripheral blood mononuclear cells (PBMCs) were collected from 89 acute COVID-19 donors. (A) COVID-19 disease severity composition; mild (n = 21, blue), moderate (n = 35, yellow), and severe (n = 33, red). The p-value listed above the pie chart was calculated by a one sample Wilcoxon t test. (B) Days post-symptom onset (PSO) for the different disease severities. Bars represent the median with 95% confidence intervals. p-value is calculated by Kruskal–Wallis t test. (C) Percentage of female (dark grey) and male (white) subjects by disease severity. p-value is calculated by Friedman one-way ANOVA. (D) Age composition for each disease severity category. Bars represent the median and 95% confidence interval and the Kruskal–Wallis t test p-value is listed above the graph. When the Kruskal–Wallis t test was significant, Mann–Whitney U tests were applied between disease severities. * p < 0.05, ** p < 0.01, **** p < 0.0001.

