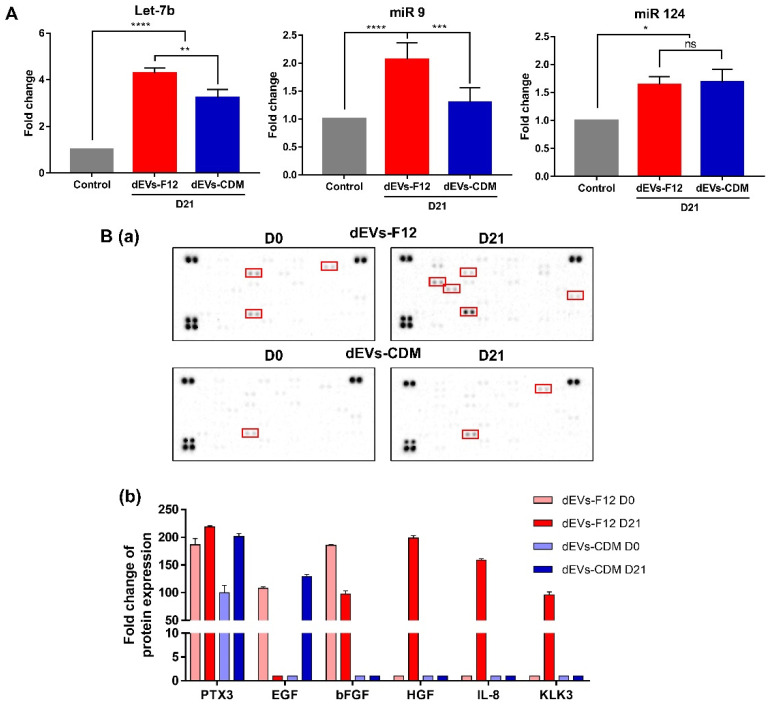
Figure 5.
miRNA expressions for Let-7b, miR 9, and miR 124. (A) Quantification of the miRNA expressions related to neurogenesis of dEVs using RT-qPCR. (B) Cytokine expressions in dEVs. Representative images of cytokine array membranes (a) and quantification as a fold change (b). **** p < 0.0001, *** p < 0.001, ** p < 0.01, * p < 0.05, and ns = no significant. One-way ANOVA was followed by Tukey’s test. Error bars represent standard deviation (SD).

