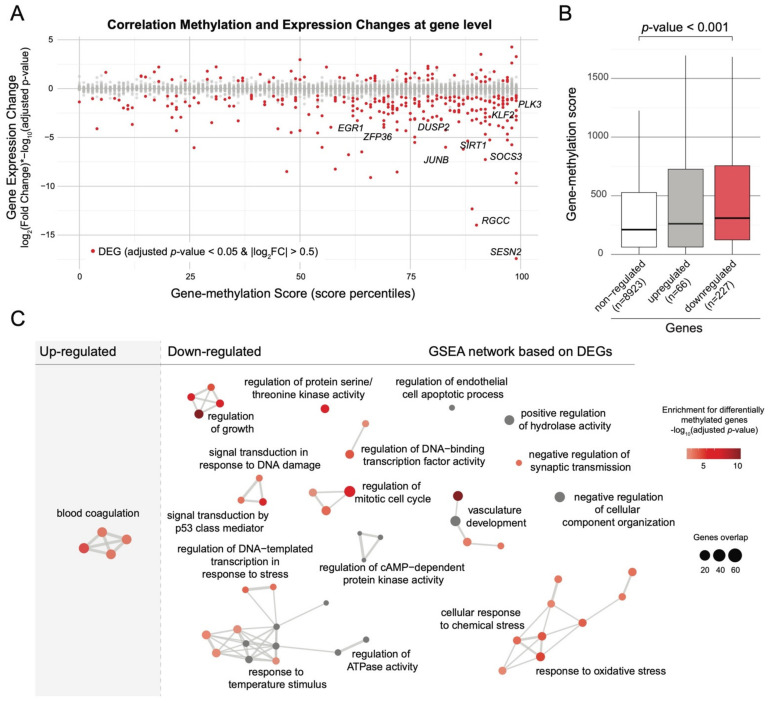
Figure 3.
Association between changes in DNA methylation and in gene expression. (A) Dot plot representing the correlation between DNA methylation and gene expression changes. Differentially expressed genes with adjusted p-value < 0.05 and |log2FC| > 0.5 are shown in red. (B) Boxplots representing gene-methylation score distribution associated with non-DEG, up-regulated, and down-regulated genes (Wilcoxon test). (C) Network representation of significantly enriched pathways identified through GO GSEA analysis based on DEG identified comparing LGA vs. CTRL. Nodes are color-coded based on enrichment for differentially methylated genes using the gene-methylation score. Edges represent interactions between pathways.

