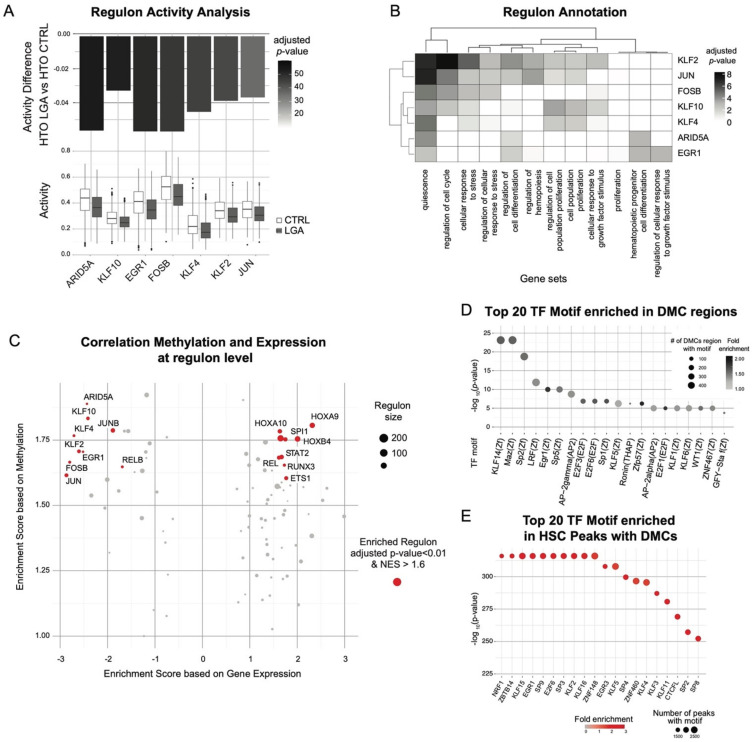
Figure 5.
Epigenetic programming of HSC-specific regulons altered in LGA neonates. Regulons and TF target information were obtained through the SCENIC workflow. (A) Boxplots representing regulon activity score in CTRL and LGA HSC lineage. Barplot representing the change in regulon activity and significance comparing LGA vs. CTRL. Only significantly affected regulons are represented (adjusted p-value < 0.001 and |activity score fold change| > 10%). (B) Heatmap representing association between altered regulons and selected gene sets annotation. (C) Volcano plot representing enrichment in the change in expression and DNA methylation in regulons. Regulons enriched considering both expression and methylation (adjusted p-value < 0.01 and NES > 1.6) are in red. (D) Dot plot representing enrichment for TF binding motifs using HOMER considering a ±20 bp region around DMCs. Dots are color-coded based on the significance of the enrichment and y-axis represent the number of regions with binding motif among DMCs. (E) Dot plot representing enrichment for TF binding motifs using HOMER considering peaks with DMCs. Dots are color-coded based on the fold-enrichment and y-axis represents the significance of the enrichment.

