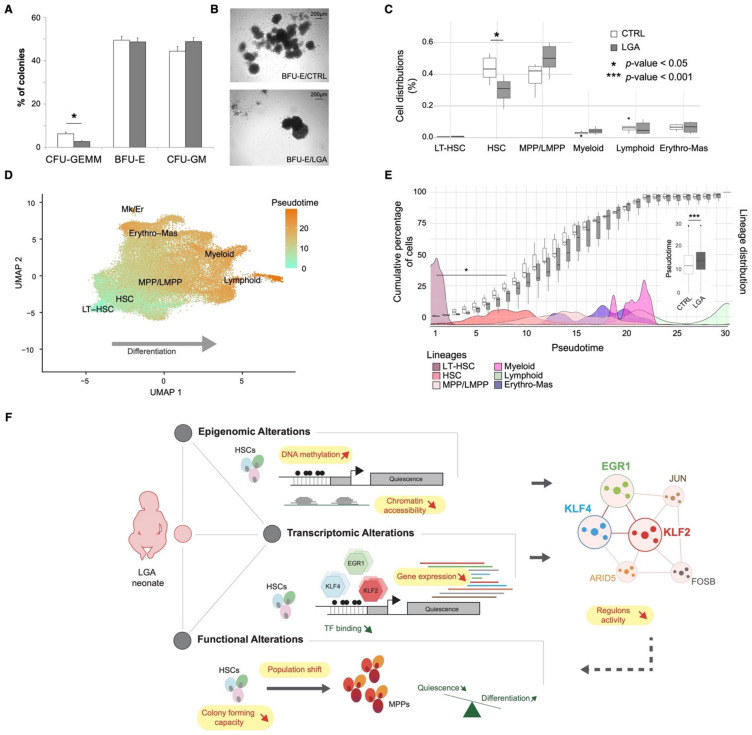
Figure 7.
LGA is associated with decreased expansion capacity and an HSC shift toward more differentiated cells. (A) Bar plot representing colonies distribution after CFU assays. (B) Representative capture of colonies’ morphological differences found in CTRL and LGA. (C) Boxplots representing the cell distribution across hematopoietic main lineages in CTRL and LGA. (D) UMAPs representing pseudotimes across lineages. (E) Box plots representing the cumulative percentage of cells per pseudotime in CTRL and LGA. Boxplots in the vignette represent overall pseudotime distribution in CTRL and LGA. Density plots correspond to cell populations distribution across pseudotimes. (F) Model recapitulating the influence of LGA on the hematopoietic compartment. (LT-HSC, long-term hematopoietic stem cell; HSC, hematopoietic stem cell; MPP, multipotent progenitor; LMPP, lymphoid-primed multipotent progenitors; Erythro-Mas, erythroid and mast precursor; Mk/Er, megakaryocyte and erythrocyte; DC, dendritic cell; CFU-GEMM, common myeloid progenitors; BFU-E, erythroid progenitors; CFU-GM, granulocyte-macrophage progenitors.

