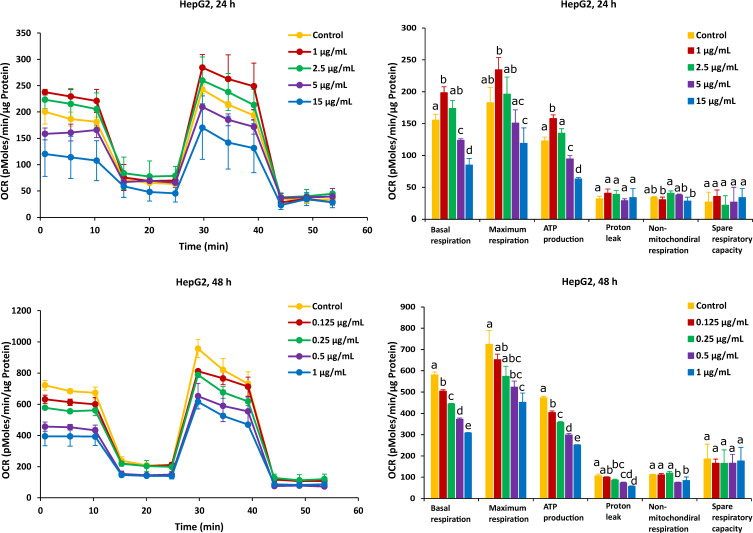
Figure 6.
Effect of AFB1 on oxygen consumption rate (OCR) (left) and different mitochondrial parameters (right) in HepG2 cells after 24 h and 48 h of exposure. Data (at least four technical replicates) are expressed as mean ± standard deviation. Mean values with different letters (a–e) within each mitochondrial parameter indicate significant differences (p < 0.05) between different AFB1 treatments according to one way ANOVA test followed by Tukey HSD multiple-comparison test as a post hoc analysis.

