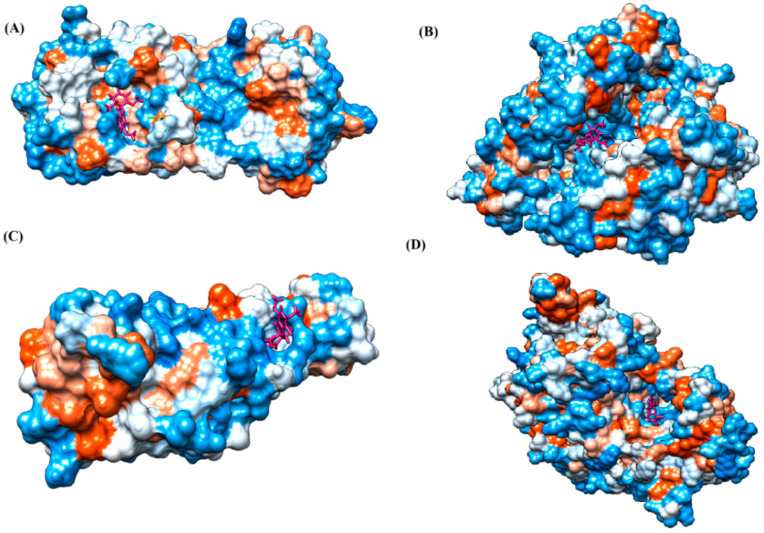
Figure 1.
Ligand binding site prediction at (A) M protease, (B) ACE2, (C) RBD, and (D) RdRp hydrophobicity surface model, with ligand binding pockets in the protein structure. Dodger blue represents the most hydrophilic; the scale then moves to white, then to orange-red for the most hydrophobic regions. The ligand molecule (griseofulvin) is shown in bold, colored pink. Images were obtained by Chimera 1.15.

