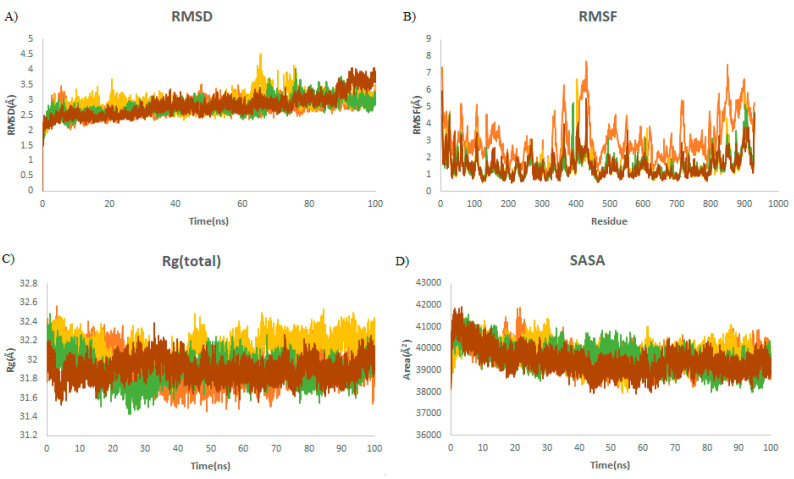
Figure 5.
Structural dynamics of RdRp. (A) Root mean square deviation (RMSD), (B) root mean square fluctuations (RMSF), (C) radius of gyration (Rg) plot, and (D) solvent-accessible surface area (SASA). Orange color indicates RBD-free form; yellow, green, and brown indicate RdRp in a complex with griseofulvin, Rd6, and Rd2, respectively.

