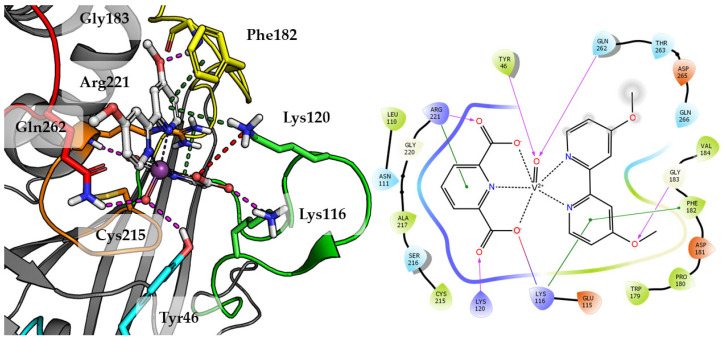
Figure 7.
Docking result of Compound 4 to the PTP1B active site (PDB: 1ONZ). Left panel presents a studied compound as white sticks with protein represented by a gray cartoon. Significant loops are highlighted with separate colors; P-loop in orange, WPD-loop in yellow, E-loop in green, and Q-loop in red. The most important amino acids are represented as sticks with the same color code. Coordinate bonds are marked with thin dotted lines. Hydrogen bonds are marked in magenta, ionic interaction in red, aromatic π-π, CH-π and cation-π in green. Right panel presents 2D ligand interaction diagram.

