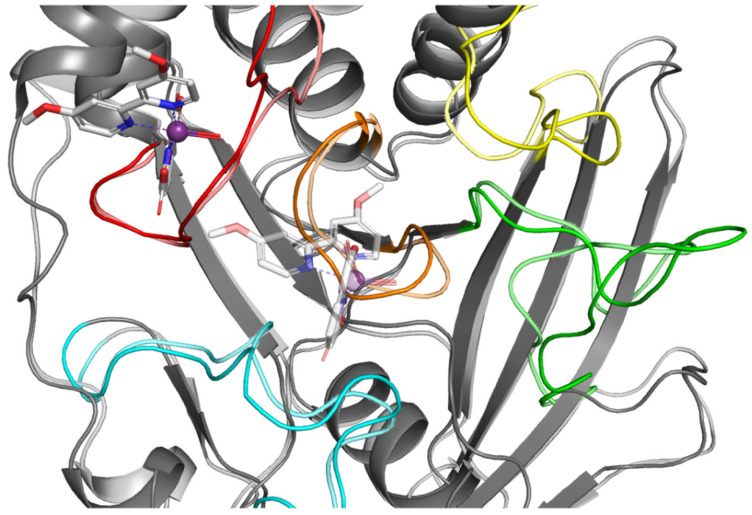
Figure 10.
Result of MD simulation of Compound 4 (white sticks) and the PTP1B complex (2FJN). Transparent structures present a studied complex on start of simulation and filled structures present position after 50 ns. We highlight significant loops with separate colors; P-loop in orange, WPD-loop in yellow, E-loop in green, and Q-loop in red.

