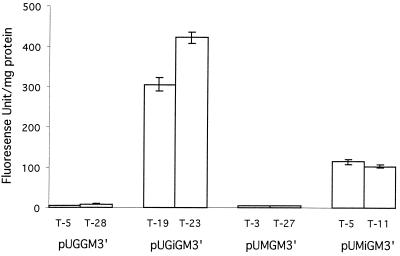
FIG. 2.
Bar graph showing the fluorescence emission intensity at 509 nm of transformants carrying the various constructs shown in Fig. 1. Transformants exhibiting the highest fluorescence intensity for each construct were grown at 37°C for 40 h as described in the text. Crude extracts from triplicate cultures of the various transformants were prepared, and fluorescence was measured as described in the text. The means and deviations of triplicate values are shown.

