Figure 1.
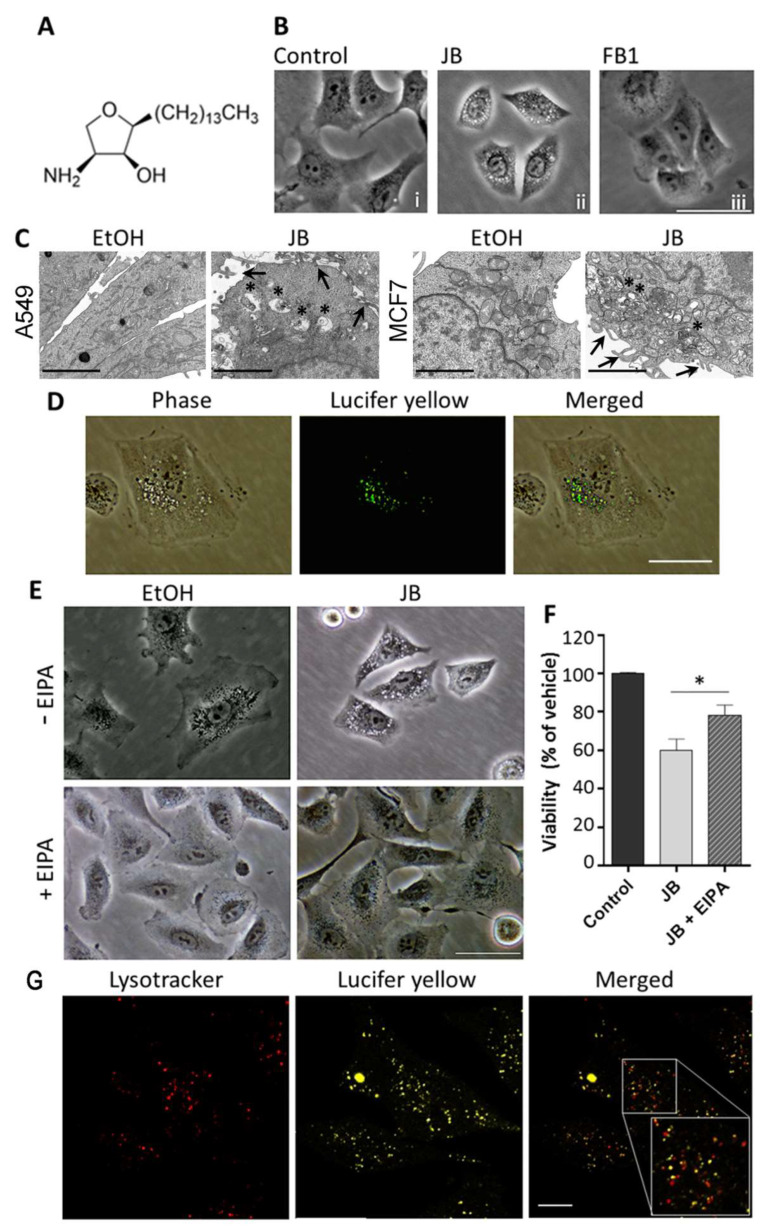
Induction of cell vacuolization by Jaspine B (JB) in A549 cells. (A) Chemical structure of JB. (B) Phase contrast images of A549 cells treated with 0.05% ethanol for 24 h, 5 µM JB for 4 h, or 50 µM Fumonisin B1 (FB1) for 24 h. The images are representative of three experiments performed in triplicate. Scale bar: 50 µm. (C) TEM images of A549 cells treated with 0.05% ethanol for 4 h or 10 µM JB for 5 h and MCF7-LC3GFP cells treated with 0.05% ethanol for 6 h or 10 µM JB for 6 h. Arrows point to membrane extensions at the surface of A549 or MCF7 cells and asterisks show endolysosome accumulation indicating defective endocytic flux. Scale bars: 2 µm. (D) Incorporation of Lucifer yellow (LY) in A549 cells incubated with 5 µM JB and 0.5 mg/mL LY for 4 h. Scale bar: 50 µm. (E) Phase contrast images of A549 cells pretreated with 25 µM 5-[N-ethyl-N-isopropyl] amiloride (EIPA) (or methanol) for 1 h and then treated with 5 µM JB (or ethanol) for 24 h. The images are representative of two independent experiments performed in triplicate. Scale bar: 50 µm. (F) Viability of A549 cells pretreated with 25 µM EIPA (or methanol) for 1 h and then treated with 5 µM JB (or ethanol) for 24 h, as assessed with 3-(4,5-dimethylthiazol-2-yl)-2,5-diphenyl tetrazolium bromide (MTT). Control cells were treated with vehicles (without EIPA and without JB). Results are the mean ± SD of two experiments in triplicate. * p < 0.0005. (G) A549 cells were treated with 5 µM JB and 0.5 mg/mL LY for 4 h. An amount of 75 nM LT was added 0.5 h prior to visualization. Scale bar: 10 µm.

