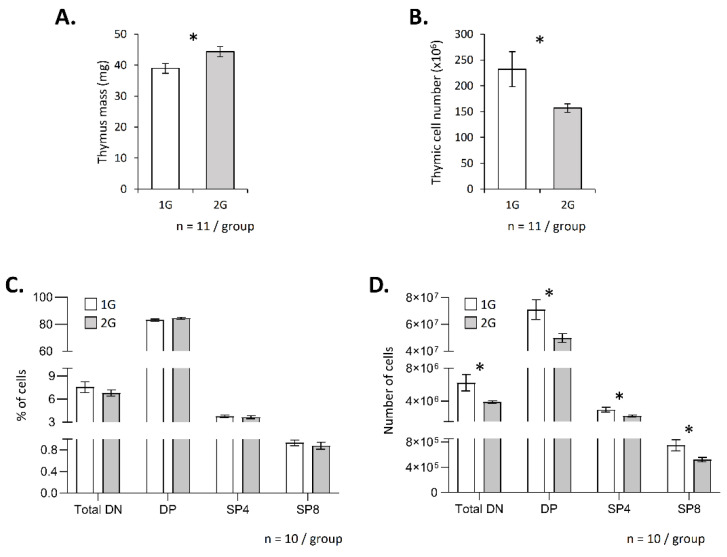
Figure 1.
Hypergravity affects T lymphopoiesis. Thymus mass (A) and thymic cell number (B) in adult mice exposed to 2× g hypergravity for three weeks. (C,D) Analysis of T lymphopoiesis by flow cytometry. T-cell subpopulations were identified using CD4, CD8, CD3 and TCR staining. For each mouse, staining was done in duplicate, and mean was calculated. (C) Percentage of each subpopulation. (D) Absolute number of cells in each subpopulation. Data are the mean ± SEM of 11 (A,B) or 10 mice (C,D) per group. Mann–Whitney or t-tests were used to reveal statistically significant differences. * p < 0.05.

