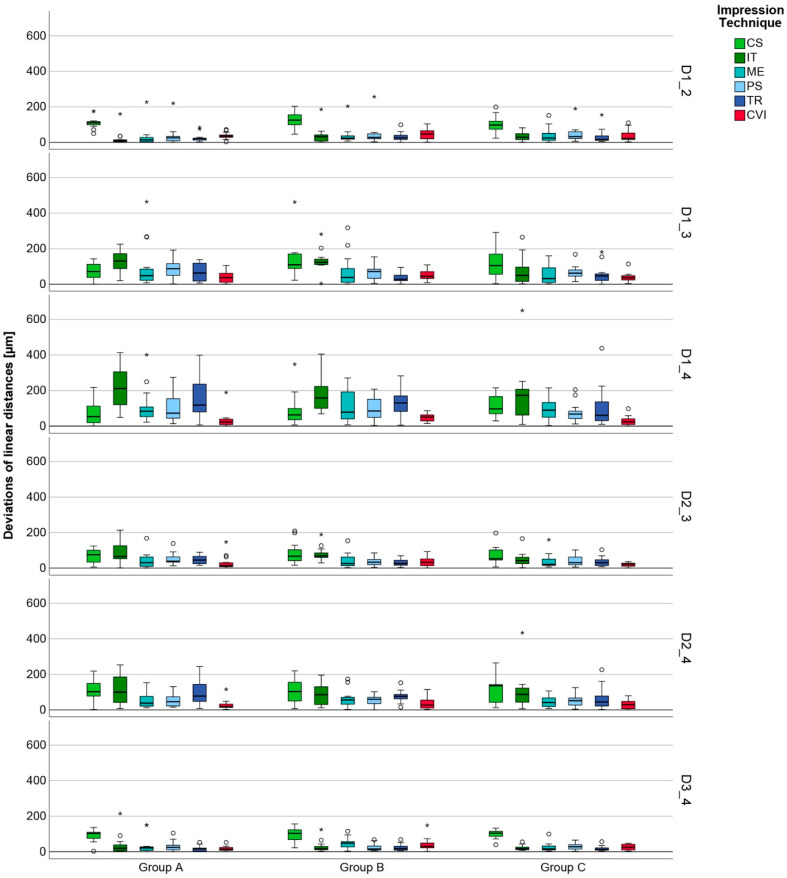
Figure 5.
Boxplot diagram of the deviations of the linear distances (D1_2, D1_3, D1_4, D2_3, D2_4, D3_4) in group A, B, and C for the six techniques (CS = CS 3800, IT = iTero Element 5D, ME = Medit i700, PS = Primescan, TR = Trios 4, CVI = conventional impression); outliners (o), extreme values (*).

