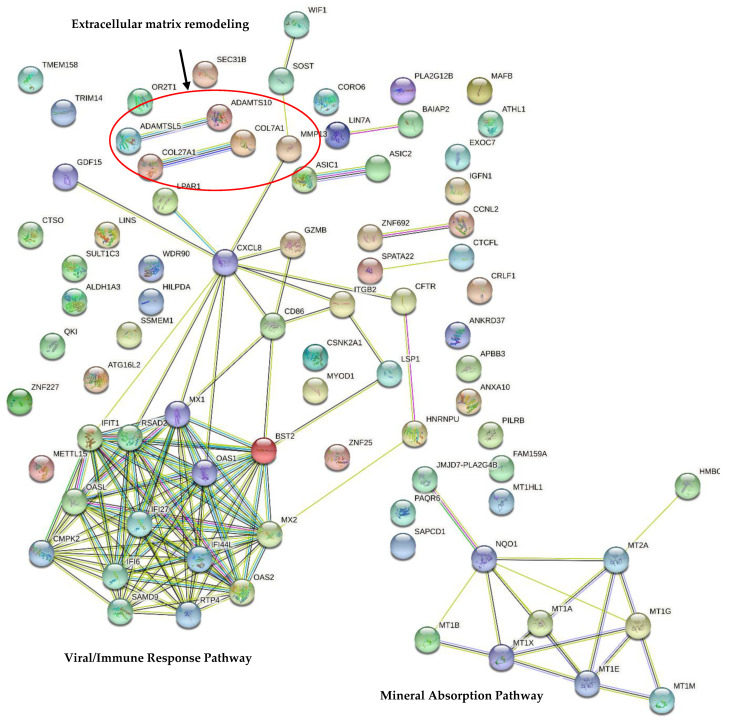
Figure 9.
The STRING network of gene–gene interactions in Saos-2 cells exposed to the rough surfaces (Ra = 1 µm) of Y-TZP discs for 96 h (STRING database version 11.5). A list of all differentially expressed genes in Saos-2 cells exposed to the rough surfaces of Y-TZP discs for 96 h (FC ≥ |1.5, |f-value ≤ |0.01) (Supplementary Table S1) was injected into STRING database v11.5. The 2 significantly enriched KEGG pathways (determined using the DAVID database) are represented in bold. Legend: Network nodes represent proteins, edges represent protein–protein associations (red line: the presence of fusion evidence; green line: neighborhood evidence; blue line: co-occurrence evidence; purple line: experimental evidence; yellow line: text mining evidence; light blue line: database evidence; black line: co-expression evidence).

