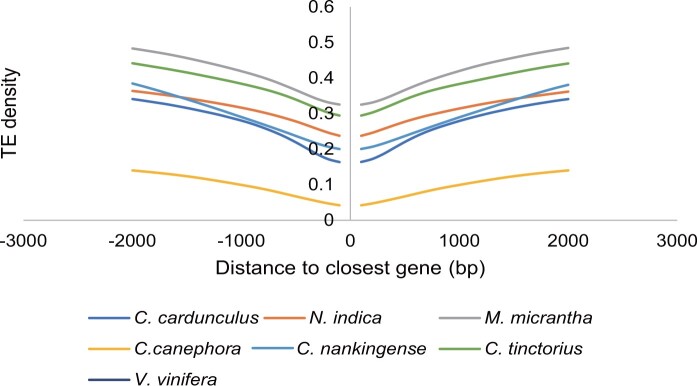
Figure 2.
Comparison of TE density around the closest genes between species. Enrichment of TEs in 100-bp bins in the regions 2 kb upstream of the start codon and 2 kb downstream of the stop codon between all genes of N. indica, C. tinctorius, C. cardunculus, C. nankingense, M. micrantha, V. vinifera, and C. canephora. The x axis indicates the distance from TEs to the start codon (stop codon) of the closest gene; the y axis indicates the density of genes with TEs at different distances to the start codon (stop codon).

