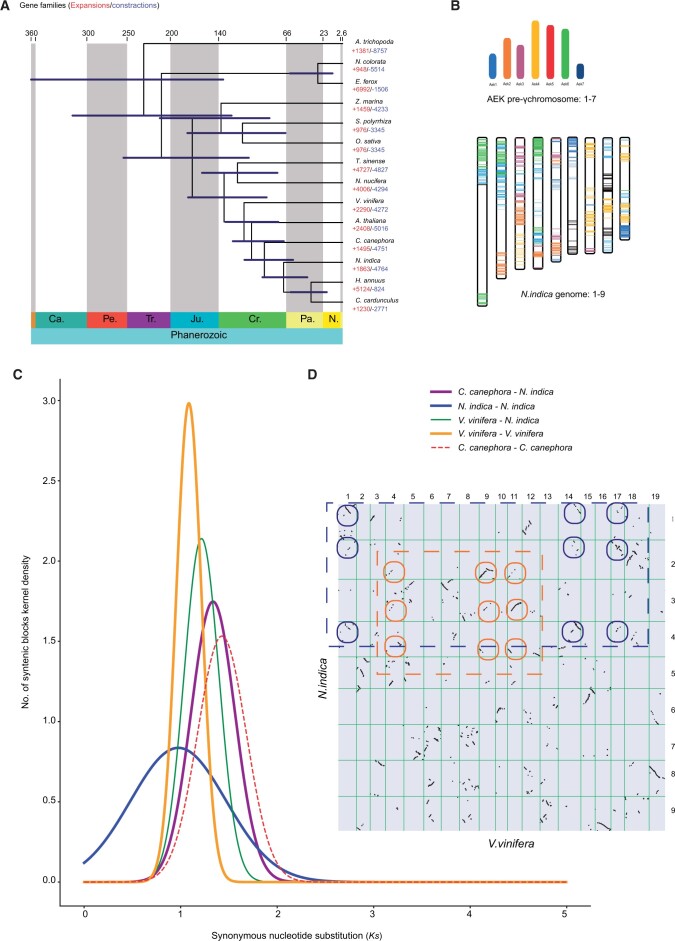
Figure 3.
Evolutionary history of N. indica. (a) Phylogenetic tree of 14 plant species and the evolution of gene families. The divergence times were estimated using MCMCTree and indicated by light blue bars at the internodes with a 95% highest posterior density. Cr: Cretaceous; Ju: Jurassic; Pa: Paleogene; Ne: Neogene. The numbers of gene-family expansions and contractions are indicated by red and blue numbers. (b) Comparison with ancestral eudicot karyotype (AEK) chromosomes reveals synteny. The syntenic AEK blocks are painted onto N. indica chromosomes. (c) Ks distributions of orthologous and paralogous genes among C. canephora, V. vinifera, and N. indica. (d) Comparison of N. indica and V. vinifera genomes. Dot plots of orthologs showing a 3–3 chromosomal relationship between the N. indica genome and V. vinifera genome.

