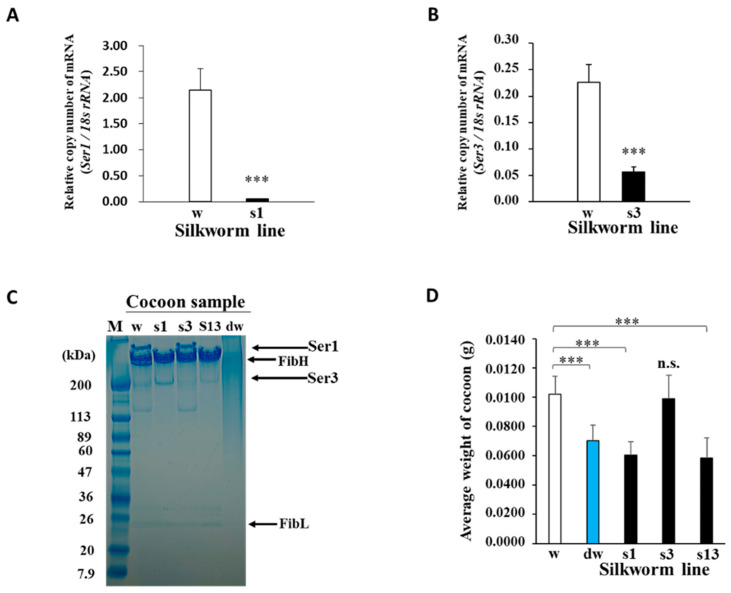
Figure 2.
Functional effects of P1A269 expression in middle silk glands (MSGs). (A,B) Quantitative RT-PCR analysis of the relative Ser1 (s1) and Ser3 (s3) mRNA levels in the Ser1-P1A269 and Ser3-P1A269 lines, respectively. Total RNAs were isolated from the MSGs of the respective larvae. The mRNA levels of Ser1 at day 5 of the fifth instar of the Ser1-P1A269 line and Ser3 at day 6 of the fifth instar of the Ser3-P1A269 line were quantified and compared with that of w1-pnd (w) at the same developmental stage, respectively. The expression levels of Ser1 and Ser3 mRNAs were normalized to that of 18S ribosomal RNA. Data are presented as the means ± SD of relative values (copy number); n = five (for Ser1 mRNA) and n = eight (for Ser3 mRNA) independent samples; *** p < 0.001 versus w1-pnd (Student’s t-test). (C) SDS–PAGE analysis of the cocoons produced by w1-pnd (lane w), the Ser1-P1A269 line (lane s1), Ser3-P1A269 (lane s3), Ser1/3-P1A269 (lane s13), and degummed w1-pnd (lane dw). The cocoons were dissolved in concentrated LiBr solution, diluted in water, and electrophoresed on a 5–20% gradient gel, along with the protein marker (lane M). Arrows on the right indicate the positions of FibH, FibL, Ser1, and Ser3 [4,5]. (D) Comparison of the cocoon weights. The dry weight of w1-pnd (w), degummed w1-pnd (dw), the Ser1-P1A269 line (s1), Ser3-P1A269 (s3), and Ser1/3-P1A269 (s13) cocoons were measured. Data are presented as the means ± SD; n = 50 independent samples. *** p < 0.001 (one-way ANOVA, followed by Tukey’s test); n.s., not significant versus w1-pnd.

