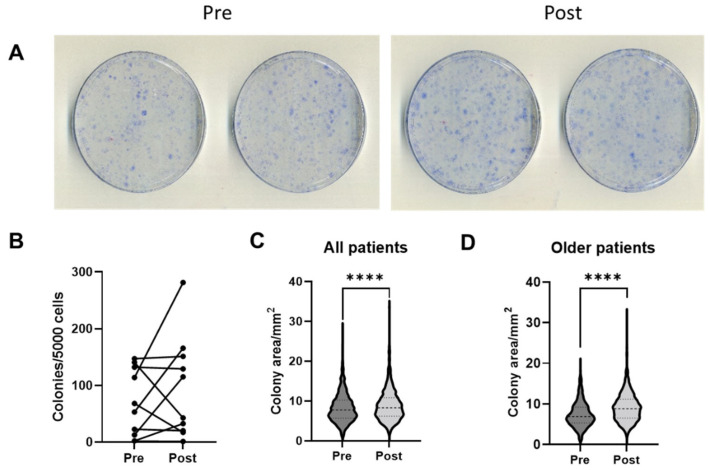
Figure 1.
Colony-forming capacity in p1 MSCs before (Pre) and 2 weeks after (Post) PRP infiltrations (n = 10 patients, symbols represent averages of the duplicate dishes). (A) Images of duplicate dishes from a representative patient. (B) CFU-F frequencies in the Pre and Post samples. (C) Violin plots showing the colony area distributions in all patients. (D) Violin plots showing the colony area distributions in older (>60 years old) patients. **** p < 0.0001, Mann–Whitney U test.

