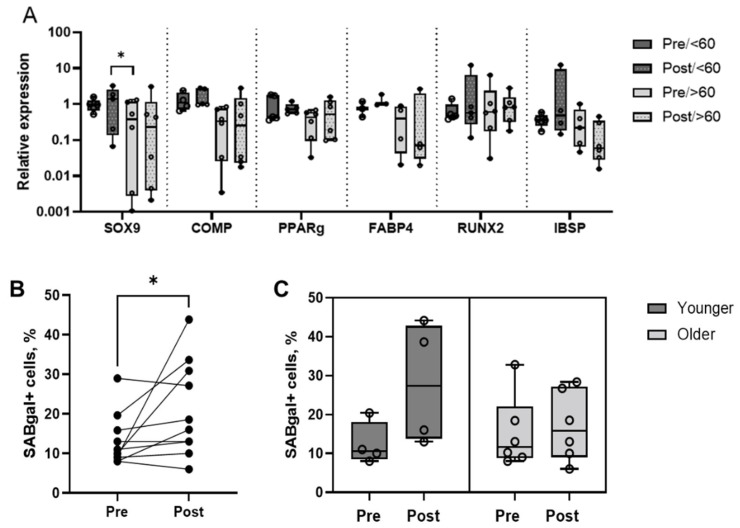
Figure 2.
The MSC multipotentiality marker expression and the proportions of senescent cells in p1 MSCs before (Pre) and 2 weeks after (Post) PRP infiltrations. (A) Relative expression of SOX9, COMP, PPARγ, FABP4, RUNX2, and IBSP in the Pre and Post samples segregated by age. (B) Comparison of senescent cell percentages in the Pre and Post samples (all patients). (C) Comparison of the senescent cell percentages in the Pre and Post samples (patients segregated by age). Circular symbols in all panels represent individual patients, horizontal bars on C represent medians, * p < 0.05, Wilcoxon rank sum test.

