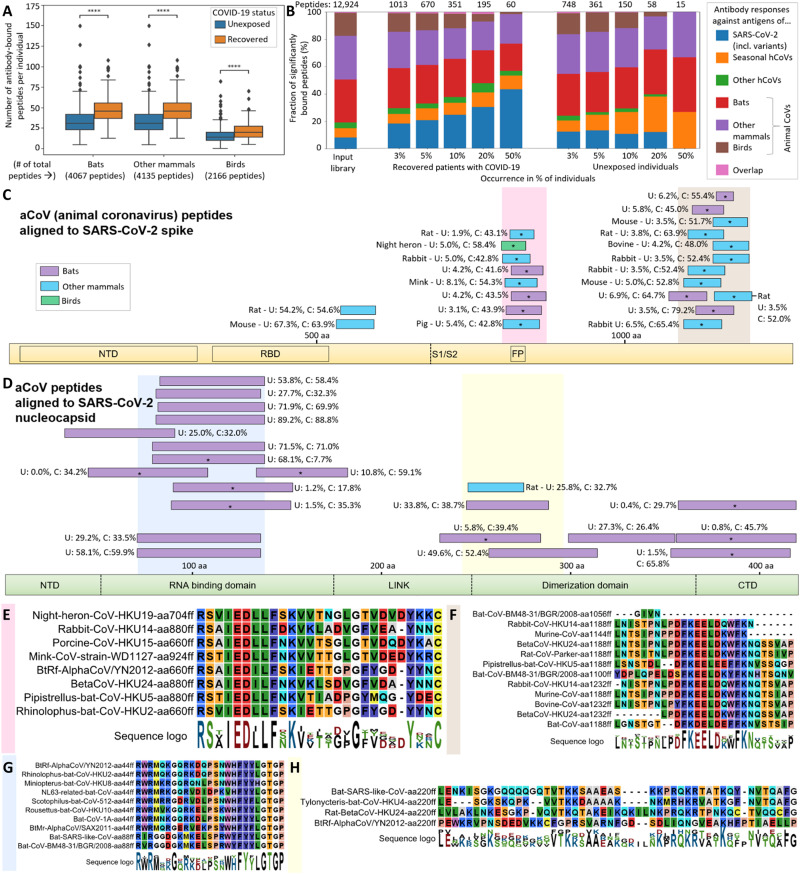
Fig. 4. aCoV cross-reactive antibody responses.
Cross-reactivity of human serum antibodies extends toward aCoVs in both SARS-CoV-2–recovered patients and unexposed individuals (A and B). Alignments of bound aCoV peptides to SARS-CoV-2 cluster in similar regions of the spike (C) and nucleocapsid (D) protein, with shared motifs of bound spike (E and F) and nucleocapsid (G and H) peptides highlighted. (A) Antibody responses against antigens of 49 aCoVs are summarized for the groups indicated (separate data for each strain are shown in fig. S5). In all panels of this figure, antibody binding data of the full set of 269 recovered patients with COVID-19 and 260 unexposed individuals are shown. “# of total peptides” refers to number peptides included for each strain within the library (Fig. 1B), whereas the number of antibody-bound peptides per individual is plotted for each group on y axis. The center line shows the median, box limits indicate the 25th and 75th percentiles as determined by Seaborn software, whiskers extend 1.5 times the interquartile range from the 25th and 75th percentiles, and outliers are represented by dots. Significance between the groups was calculated with the Mann-Whitney test (****P < 10−4; see fig. S5 for additional P value criteria). (B) Ratios of hCoVs and aCoVs antigens bound at different frequencies in recovered patients with COVID-19 and unexposed individuals. The input library is shown as control representing the library content before testing for antibody binding. The numbers on top of the panel indicate the absolute number of peptides per group (as each bar shows a relative distribution between the groups). “Other hCoVs” includes SARS-CoV and MERS-CoV. “Overlap” refers to a few identical peptides of multiple strains that cannot be assigned to a single group. (C and D) Alignments of S and N peptides of aCoVs to SARS-CoV-2 S protein (C) and N protein (D). The peptides were aligned using the BLAST algorithm in standard parameters, and only aligned regions of the peptides are shown. Peptides bound at significantly different percentages (chi-squared/Kolmogorov-Smirnov test and passing FDR correction; see data file S3) between unexposed (U) individuals or recovered patients with COVID-19 (C) shown are marked with an asterisk. The abundance of binding in U and C is indicated as percentages written next to the peptides. Nonsignificantly scored peptides are only shown if being bound in >20% of unexposed individuals and patients with COVID-19. Because of the large number of significantly bound aCoV S peptides, only peptides being bound in >40% of recovered individuals are shown, whereas a full list is provided in data file S3 (including BLAST alignments). The S/N protein domain structure at the bottom of each panel as outlined in Fig. 3. Because of the different lengths of S and N proteins, the two panels are not drawn at the same scale. (E to H) Motifs from alignments of bound aCoV S peptides in the regions marked in light red (E) and light brown (F) in (C) and bound aCoV N peptides in the regions marked in light blue (G) and light yellow (H) in (D). See fig. S7 for full alignments of the peptides and details.

