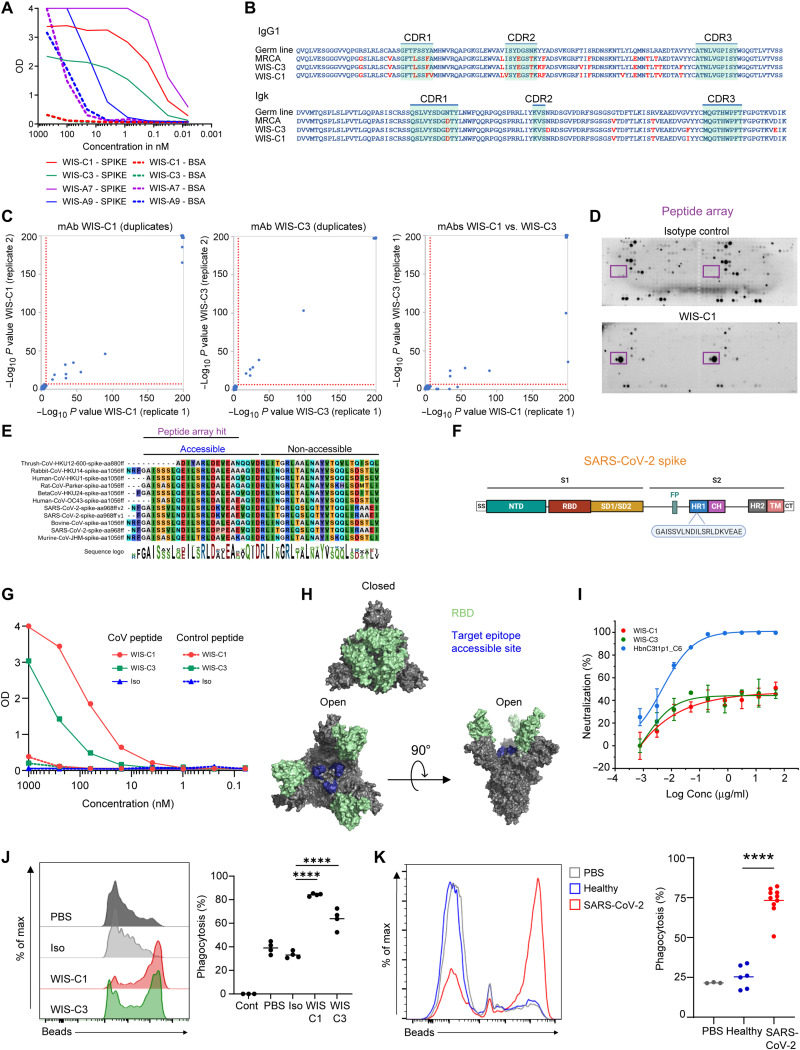
Fig. 6. Patient-derived, pan-specific mAbs.
(A) mAb reactivity to spike protein and BSA at different concentrations by ELISA. (B) Comparison between amino acid sequences of WIS-C1 and WIS-C3 to their germ line and most recent common ancestor (MRCA) configurations. Mutated amino acids appear in red. (C) PhIP-Seq–based identification of targeted peptides within the CoV-antigen library of WIS-C1 (left), WIS-C3 (middle), and comparison of the peptides bound by the two antibodies (right). The two mAbs were mixed with the phage displayed antigen library and processed in the same way as serum samples. Reaction mixtures were set up in duplicates and significantly bound peptides are marked (threshold indicated by dotted red line). The maximum P values computed are cut off at −log10 200. See fig. S8 for a list of significantly bound peptides. (D) Epitope mapping using spike peptide array of isotype control antibody (top) and the WIS-C1 antibody (bottom). WIS-C1 epitope target is shown in the purple rectangle. (E) Motif analysis of the target epitope of WIS-C1 and WIS-C3, obtained by multiple sequence alignment of the top 6 hCoVs and top 9 aCoVs PhIP-Seq hits. See fig. S8 for full alignments of the peptides and details. (F) Linear SARS-CoV-2 spike schematics depicting the location of the target epitope on the viral protein. (G) Binding of WIS-C1 and WIS-C3 to the target or control peptide by ELISA. (H) WIS-C1 and WIS-C3 target epitope projected on the crystal structure of SARS-CoV-2 spike in the closed (top) and open (bottom) confirmations. (I) Neutralization activity of pseudo-viruses by WIS-C1 and WIS-C3 compared with HbnC3t1p1_C6, as a positive control. Representative of two independent experiments; error bars indicate SDs of technical repeats. (J and K) Fluorescence-activated cell sorting plots depicting the uptake of fluorescent spike-coated spheres by THP-1 monocytes in the presence of (J) mAbs or (K) patient sera. (J) Four independent experiments; ****P < 0.0001, one-way analysis of variance or (K) a representative of two independent experiments; ****P < 0.0001, two-tailed Student’s t test. OD, optical density.

