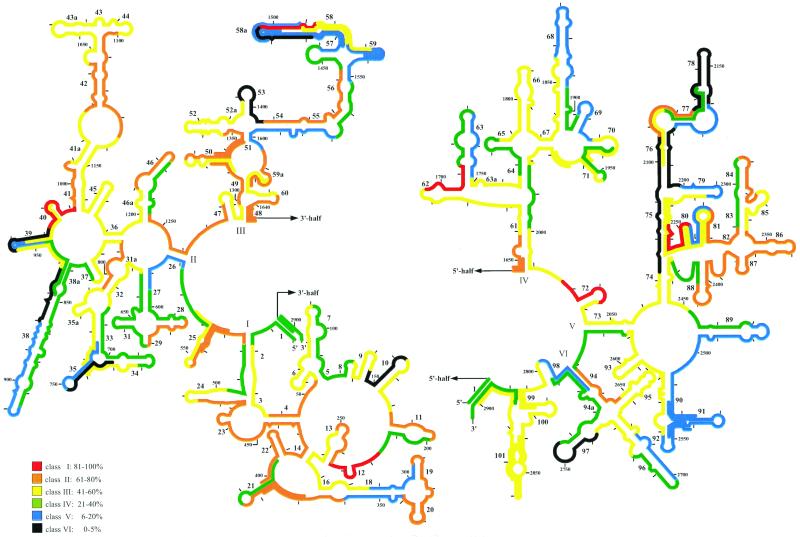
FIG. 1.
Fluorescence intensities of all oligonucleotide probes, standardized to that of the brightest probe, 23S-2018, shown in a 23S rRNA secondary structure model (7). The 5′ and the 3′ halves of the 23S rRNA are depicted on the left and right, respectively. The color coding indicates differences in the level of probe-conferred fluorescence. Additional probes for a detailed analysis of four regions with steep changes in accessibility are included in the graphs.

