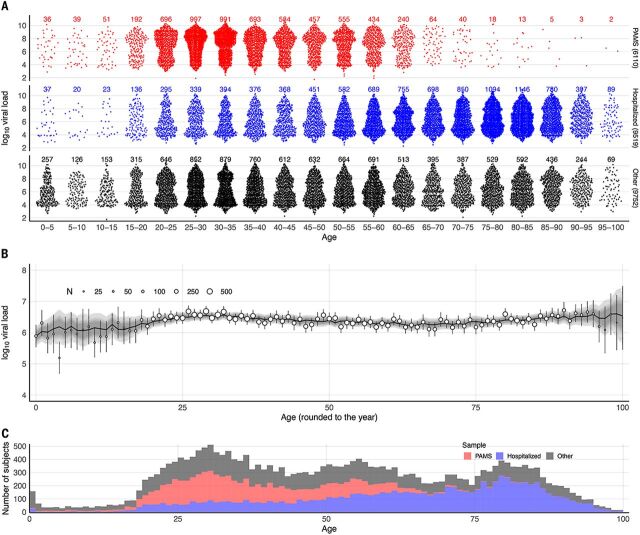
Fig. 1. Distribution of age and first-positive viral load in PAMS, Hospitalized, and Other subjects.
(A) Distribution of observed first-positive viral loads for 25,381 subjects according to clinical status (6110 PAMS, 9519 Hospitalized, 9752 Other) and age group. (B) Age–viral load association. Observed viral loads are shown as circles (circle size indicates subject count) with vertical lines denoting confidence intervals; model-predicted viral loads are shown as a black, roughly horizontal line, with gray shading denoting credible intervals. (C) Stacked age histograms according to subject clinical status. Because inclusion in the study required a positive RT-PCR test result, and because testing is in many cases symptom-dependent, the study may have a proportion of PAMS cases that differs from the proportion in the general population.

