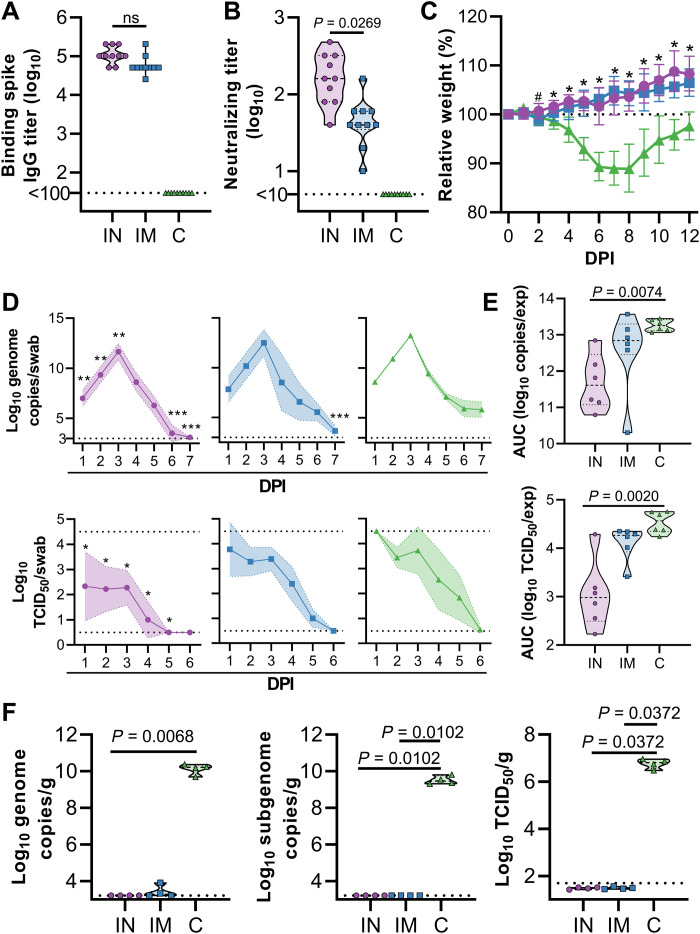
Fig. 1. IN ChAdOx1 nCoV-19 vaccination protects Syrian hamsters from SARS-CoV-2 infection.
Hamsters (n = 10 per group) were vaccinated via the IN route (purple), IM route (blue), or with control (C) vaccine ChAdOx1 GFP via the IM route (green). (A) Binding antibody titers against SARS-CoV-2 S protein in serum are shown for day 28 after vaccination. (B) VN antibody titers in serum are shown for day 28 after vaccination. For (A) and (B), the geometric mean and 95% confidence interval are shown. Dotted line, limit of detection. (C) Relative weight was measured as a percent of starting weight at indicated days postinoculation (DPI) with SARS-CoV-2. #P < 0.05 between IN and control group; *P < 0.05 between vaccinated groups and control group. Geometric mean and 95% confidence interval are shown. (D) Viral load and viral titer in oropharyngeal swabs are shown as geometric mean (symbols) and 95% confidence interval (shade). *P < 0.05, **P < 0.01, and ***P < 0.001 relative to controls at the same time point. Dotted line, limit of detection. (E) Area under the curve (AUC) analysis is shown for viral load and titer detection in oropharyngeal swabs over 7 days postinoculation. (F) Viral load and titer in lung tissue isolated at 5 DPI are shown. For (E) and (F), the dashed line within the violin plots indicate median; dotted lines within the violin plot indicate quartiles. Statistical analyses are done using mixed-effect analyses (C), two-way ANOVA (D), or Kruskal-Wallis test (E and F).

