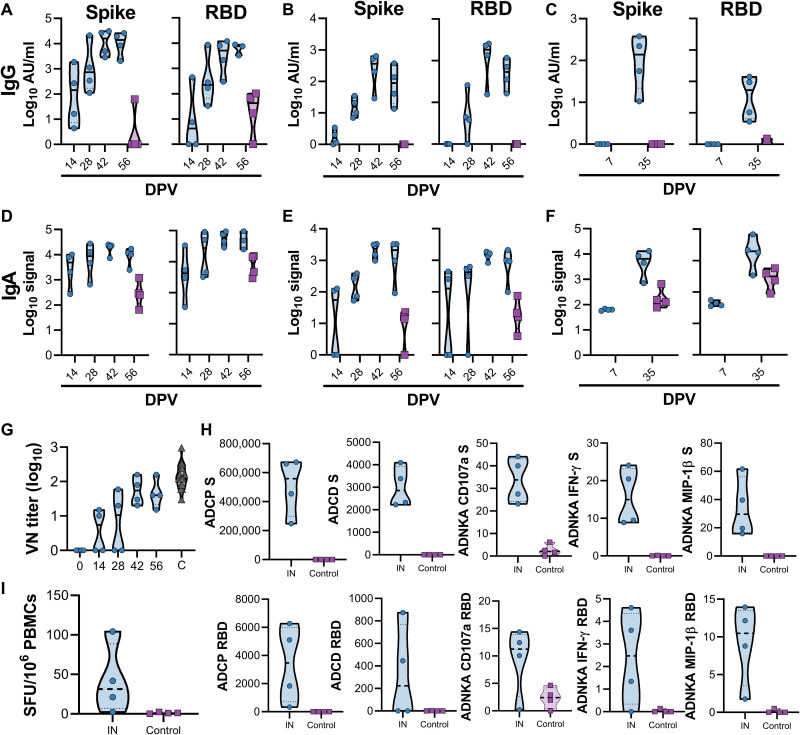
Fig. 5. IN vaccination with ChAdOx1 nCoV-19 in rhesus macaques induces humoral and cellular immune responses.
(A to C) Truncated violin plot of SARS-CoV-2–specific IgG antibodies measured in serum (A), nasosorption samples (B), and BAL (C) shows evidence of S- and RBD-specific IgG in all three tissues at the indicated days postprime vaccination (DPV) in animals receiving IN ChAdOx1 nCoV-19 (blue, n = 4) but no serum IgG in control animals (purple, n = 4). (D to F) Truncated violin plot of SARS-CoV-2–specific IgA antibodies measured in serum (D), nasosorption samples (E), and BAL (F) shows induction of IgA at all three sites in IN-vaccinated animals. (G) Truncated violin plot of neutralizing antibodies in serum is shown compared to convalescent sera (C, black) from individuals with COVID-19. The red triangle indicates NIBSC serum control 20/130. (H) Truncated violin plot of effector functions of antibodies in serum are shown. Antibody-dependent NK cell activation (ADNKA) is shown based on expression of CD107a, IFN-γ, and MIP-1β. ADCP, antibody-dependent cellular phagocytosis; ADCD, antibody-dependent complement deposition. (I) Truncated violin plots of S protein–specific T cell responses in PBMCs isolated from vaccinated or controls animals at −14 DPI minus −56 DPI response. SFU, spot-forming units. Black lines indicate median; dotted lines indicate quartiles. Blue indicates vaccinated animals and purple indicates control animals (only 56 DPV values are shown).

