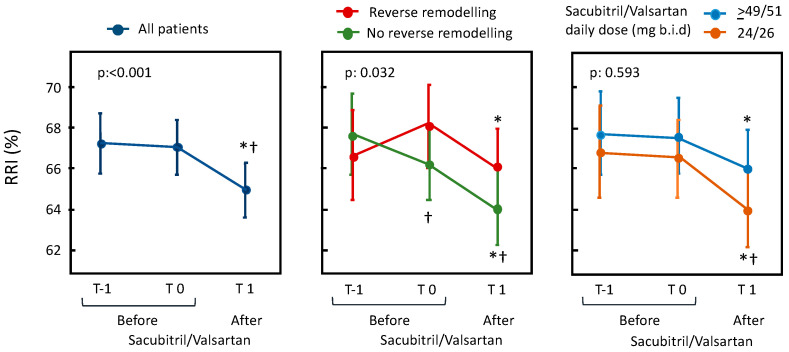
Figure 1.
In the left panel, changes in RRI before and after sacubitril/valsartan are presented. In the right panels, changes are presented depending on the occurrence of reverse remodeling after treatment with sacubitril/valsartan and on its dosage. The data are expressed as the mean and 95% confidence interval with a linear mixed model adjusted for repeated measures. p refers to the statistical significance of the model; * p < 0.05 vs. T0, † p < 0.05 vs. T-1.

